Figures & data
Table 1 Representativeness of Study Participants
Table 2 Univariate and Multivariate Analyses of Factors Associated with ES-SCLC Relapse
Figure 1 Establishment and validation of a combined nomogram in the training cohort. Nomogram based on total cholesterol (TC), high-density lipoprotein cholesterol (HDL-C), triglycerides (TG)/HDL-C, and ki67 expression was constructed to predict the 3- (Chemorefractory), 6-, and 9-month progression free survival of ES-SCLC.
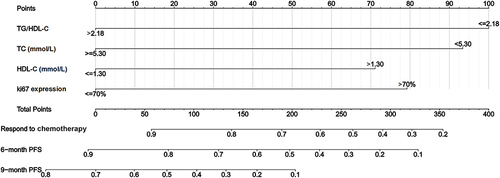
Figure 2 Validation of predictive capacity of the Nomogram in the training cohort. (A) Predictive accuracy of the nomogram was assessed by the calibration plots; (B) comparing ROC curves of the nomogram and ki67 expression for 3- (Chemorefractory), 6-, and 9-month progression free survival; (C) comparing the time-dependent decision curve analysis for the clinical benefit of the nomogram and ki67 expression.
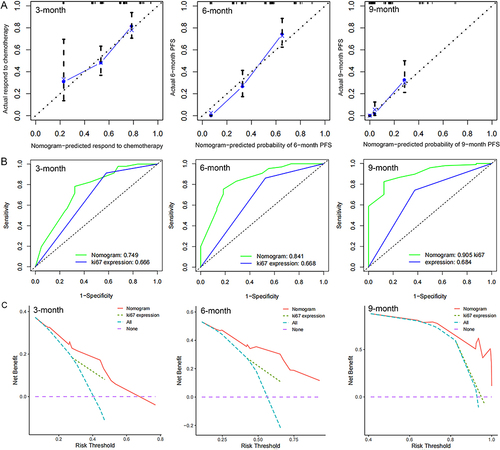
Figure 3 Validation of predictive capacity of the Nomogram in the testing cohort. (A) Predictive accuracy of the nomogram was assessed by the calibration plots. (B) Comparing ROC curves of the nomogram and ki67 expression for 3- (Chemorefractory), 6-, and 9-month progression free survival. (C) Comparing the time-dependent decision curve analysis for the clinical benefit of the nomogram and ki67 expression.
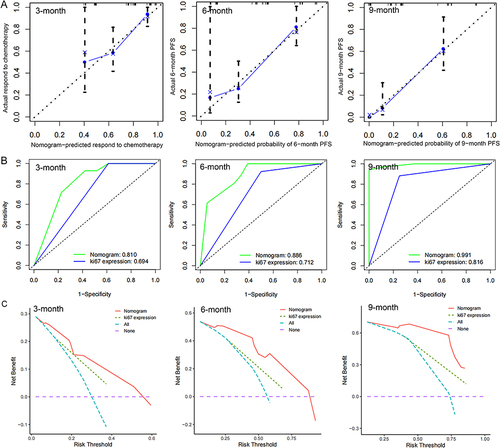
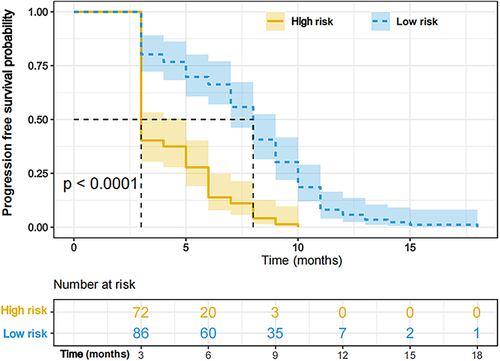
Figure 4 Validation of predictive value of the nomogram. The progression free survival curves based on nomogram correlated risk score in the whole cohort.