Figures & data
Figure 1 Large-scale identification of crotonylation sites in oral squamous cell carcinoma (OSCC) following hypoxic treatment.
Notes: (A) Schematic illustration detailing the workflow for the analysis of crotonylated proteins in CAL27 cells after 24 hr of normoxia and hypoxia culture. The process involved TMT-labeled LC-MS/MS analysis. (B) Proportional diagram displaying the number of available effective spectrograms and identified crotonylated modified peptides obtained through mass spectrometry analysis. (C) Proportional diagram illustrating the quantified crotonylated proteins. (D) Proportional diagram depicting the quantified crotonylated modification sites.
Abbreviations: OSCC, oral squamous cell carcinoma; TMT, Tandem Mass Tags; HPLC, high-performance liquid chromatography; LC-MS/MS, liquid chromatography with tandem mass spectrometry.
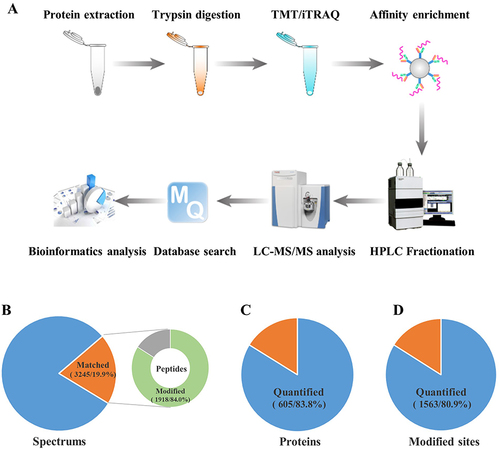
Table 1 Characteristic Sequence and Enrichment Statistical Information of Crotonylation Sites in OSCC After Hypoxic Treatment
Figure 2 Analysis of crotonylation site motifs in oral squamous cell carcinoma (OSCC).
Notes: (A) Sequence logos representing significantly enriched crotonylation site motifs surrounding the differential crotonylation sites in OSCC. Each logo visually depicts the consensus sequence and the degree of conservation at each position. (B) Heatmap illustrating the amino acid preference on both sides of the crotonylated lysine sites, displaying the frequency of different amino acids adjacent to the modified residue in OSCC. Red marks indicate enrichment, while green marks indicate depletion.
Abbreviation: OSCC, oral squamous cell carcinoma.
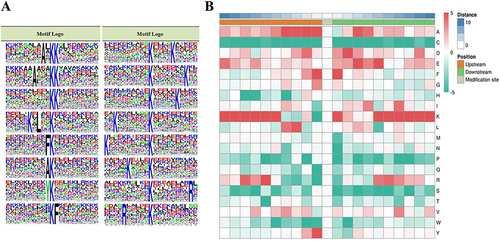
Figure 3 Analysis of differential crotonylation sites and corresponding proteins in OSCC under hypoxia conditions.
Notes: (A) Volcano plot depicting the differentially expressed crotonylation sites in OSCC under hypoxic conditions. Crotonylation sites with a fold change > 1.5 and P < 0.05 are indicated by red dots, representing upregulated sites. Crotonylation sites with a fold change < −1.5 and P < 0.05 are indicated by blue dots, representing downregulated sites. (B) Histogram illustrating the distribution of crotonylated proteins and associated sites with a fold change greater than 1.5. (C) Subcellular localization analysis of the crotonylated proteins. (D) Subcellular localization analysis specifically focusing on the up-regulated crotonylated proteins. (E) Subcellular localization analysis specifically focusing on the down-regulated crotonylated proteins.
Abbreviations: OSCC, oral squamous cell carcinoma; H, hypoxia; N, normoxia.
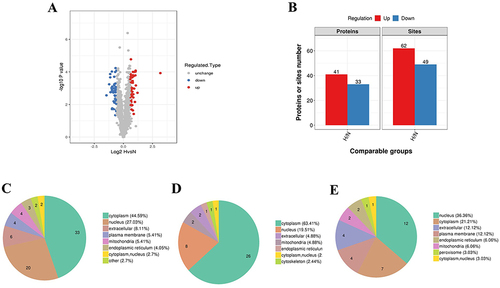
Figure 4 Functional enrichment of proteins corresponding to differential crotonylation sites in OSCC.
Notes: (A) GO enrichment analysis of proteins associated with up-regulated crotonylation sites, including cellular component, molecular function, and biological process. (B) GO enrichment analysis of proteins associated with down-regulated crotonylation sites, encompassing cellular component, molecular function, and biological process. (C) KEGG pathway enrichment analysis of proteins linked to up-regulated crotonylation sites. The red border highlights cellular metabolic-related signaling pathways. (D) KEGG pathway enrichment analysis of proteins linked to down-regulated crotonylation sites. (E) Protein domain analysis of proteins associated with up-regulated crotonylation sites. (F) Protein domain analysis of proteins associated with down-regulated crotonylation sites.
Abbreviations: GO, Gene Ontology; KEGG, Kyoto Encyclopedia of Genes and Genomes.
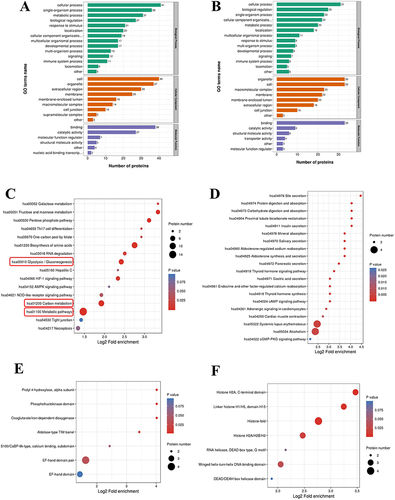
Figure 5 Functional relationships between proteins corresponding to differential crotonylation sites in OSCC.
Notes: (A) Protein–protein interaction (PPI) network of proteins associated with differential crotonylation sites. Each protein is represented by a circle, with the size of the circle indicating the number of interacting proteins. Connecting lines represent the relationships between proteins. Different colors denote up-regulated (red) or down-regulated (blue) proteins. (B) Immunoprecipitation and Western blot assay performed to detect the crotonylation modification level of HSP90AB1 in CAL27 cells following 24 hr of hypoxic culture.
Abbreviation: PPI, protein–protein interaction.
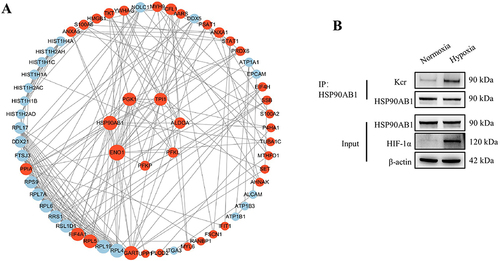
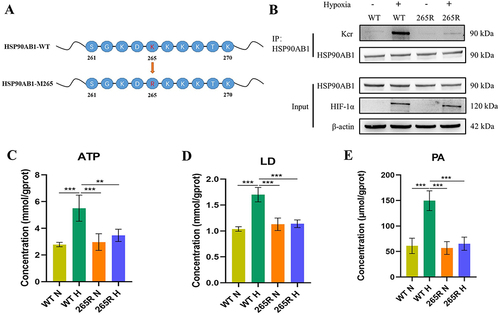
Figure 6 Crotonylation of HSP90AB1 affects its regulation of glycolysis in OSCC.
Notes: (A) Schematic diagram illustrating the plasmid mutation strategy for HSP90AB1. Lysine 265 of HSP90AB1 was mutated to arginine to prevent crotonylation. (B) Immunoprecipitation and Western blot analysis performed to detect the crotonylation modification level of HSP90AB1 in CAL27 cells under different treatments. The HSP90AB1low CAL27 cells were transfected with either wild-type (WT) or mutant plasmids and cultured under normoxic or hypoxic conditions for 24 hr. (C) Quantification of ATP levels in CAL27 cells transfected with WT or mutant HSP90AB1 plasmids and subjected to normoxia or hypoxia culture. (D) Measurement of lactic acid levels in CAL27 cells after transfection with WT or mutant HSP90AB1 plasmids and exposure to normoxic or hypoxic conditions. (E) Analysis of pyruvic acid levels in CAL27 cells transfected with WT or mutant HSP90AB1 plasmids and treated with normoxia or hypoxia. **P<0.01, ***P<0.001 compared to control.
Abbreviations: WT, wild type; ATP, adenosine triphosphate.