
Figures & data
Table 1 Comparison of the Clinicopathologic and US Features Between the Absence and Presence of Skip Metastases in PTC Patients. P value < 0.05 was Highlighted in Bold Font.
Table 2 Multivariate Logistic Regression Analysis in Predicting Skip Metastasis of LLNM in PTC Patients. P value < 0.05 was Highlighted in Bold Font.
Figure 1 Forest plot of the risk factors of skip metastasis in PTC patients.
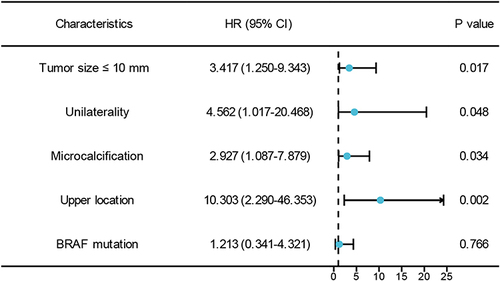
Table 3 ROC Analysis of the Independent Factors and Equation for Predicting Skip Metastasis of LLNM in PTC Patients
Figure 2 Receiver operating characteristic (ROC) curves of (a) tumor size ≤ 10 mm (area under the ROC curve [AUROC] = 0.678), unilaterality (AUROC = 0.602), microcalcification (AUROC = 0.638), and upper location of PTC (AUROC = 0.696), respectively. (b) Equation (AUROC = 0.783) for the prediction of skip metastasis.
![Figure 2 Receiver operating characteristic (ROC) curves of (a) tumor size ≤ 10 mm (area under the ROC curve [AUROC] = 0.678), unilaterality (AUROC = 0.602), microcalcification (AUROC = 0.638), and upper location of PTC (AUROC = 0.696), respectively. (b) Equation (AUROC = 0.783) for the prediction of skip metastasis.](/cms/asset/5842c953-7f3c-4339-8ef6-46fc93582ad9/dcmr_a_12297829_f0002_c.jpg)