
Figures & data
Figure 1 Inclusion criteria and treatment pattern.
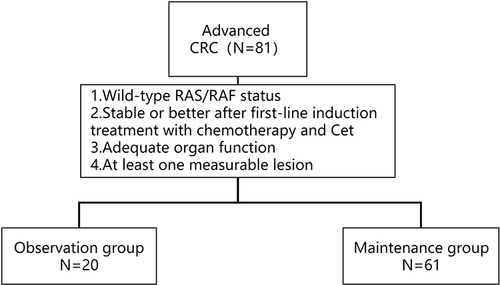
Table 1 Clinicopathological and Disease Characteristics of 81 Metastatic Colorectal Cancer Patients with Disease Control After Induction Treatment (Chemotherapy Combined with CET) at Baseline
Table 2 Treatment Modes After Induction Therapy
Table 3 Univariate Analyses for PFS and PFS During Maintenance Therapy/Observation (mnPFS)
Table 4 Multivariate Analyses for PFS and PFS During Maintenance Therapy/Observation (mnPFS)
Table 5 Univariate Analyses for PFS and mnPFS with Maintenance Therapy
Figure 2 Kaplan-Meier plot of progression-free survival (PFS) and log-rank analysis of predictors of CET-based treatment in mCRC patients (n = 81 for a to d, n = 61 for e). (a) All patients (b) Maintenance/Observation (c) Best overall response during induction therapy (d) Peritoneal metastasis (e) Maintenance therapy regimen.
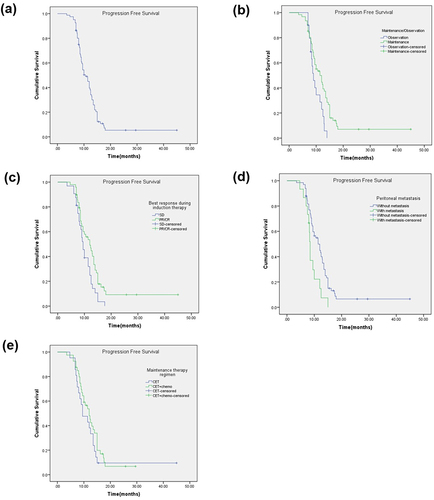
Figure 3 Kaplan-Meier plot of PFS during maintenance/observation (mnPFS) and log-rank analysis of predictors of CET-based treatment in mCRC patients (n = 81 for a to d, n = 61 for e). (a) All patients (b) Maintenance/Observation (c) Best overall response during induction therapy (d) Peritoneal metastasis (e) Maintenance therapy regimen.
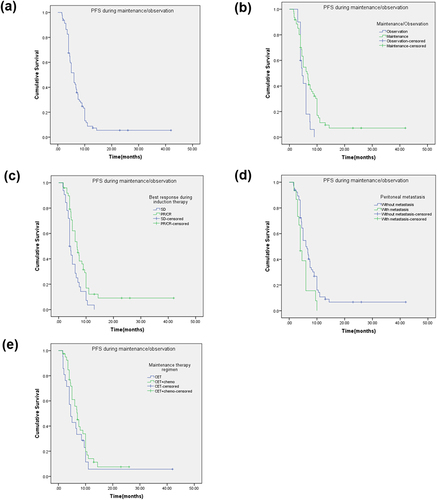
Table 6 Adverse Events Related to Treatment