
Figures & data
Table 1 Characteristics of Patients with Different Types of irAEs or Without irAEs
Table 2 Response to Immunotherapy of Cancer Patients
Figure 1 Association between irAE status and prognosis of patients. (A) The Kaplan-Meier curve of progression-free survival (PFS) in cancer patients. (B) The Kaplan-Meier curve of overall survival (OS) in cancer patients. (C) The Kaplan-Meier curve of progression-free survival (PFS) in patients with gastric cancer. (D) The Kaplan-Meier curve of overall survival (OS) in patients with gastric cancer.
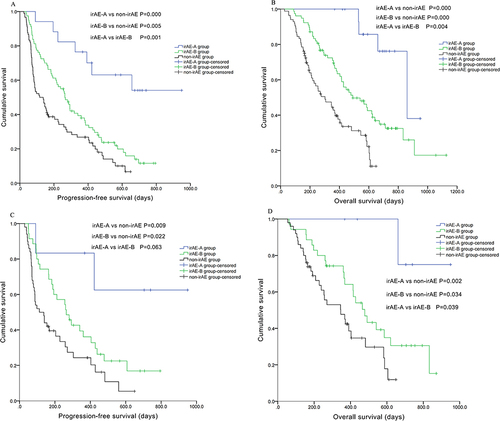
Table 3 Univariate and Multiple Extended Cox Regression Model on PFS and OS in Cancer Patients
Table 4 Characteristics of Gastric Cancer Patients Among Different Groups
Table 5 Response to Immunotherapy in Gastric Cancer Patients
Table 6 Univariate and Multiple Extended Cox Regression Model on PFS and OS in Gastric Cancer Patients