Figures & data
Table 1 Baseline Characteristics of Patients Who Received a Blood Transfusion and Those Who Did Not in Different HCC Size Subsets in the Entire Cohort (n=484)
Table 2 Baseline Characteristics of Patients Who Received a Blood Transfusion and Those Who Did Not in Different HCC Size Subsets in the Matched Cohort (n=174)
Table 3 Univariable and Multivariable Cox Regression Analysis of Recurrence-Free Survival after Resection for HCC in Propensity-Matched Patients with a Tumor Size of >4 Cm
Table 4 Univariable and Multivariable Cox Regression Analysis of Overall Survival After Resection for HCC in Propensity-Matched Patients with a Tumor Size of >4 Cm
Table 5 Univariable Cox Regression Analysis of Recurrence-Free Survival and Overall Survival Identified after Resection for HCC in Propensity-Matched Patients with a Tumor Size of ≤4 Cm
Figure 1 Kaplan–Meier curves for recurrence-free survival of blood transfusion and non-blood transfusion groups after PSM: >4 cm subset group.
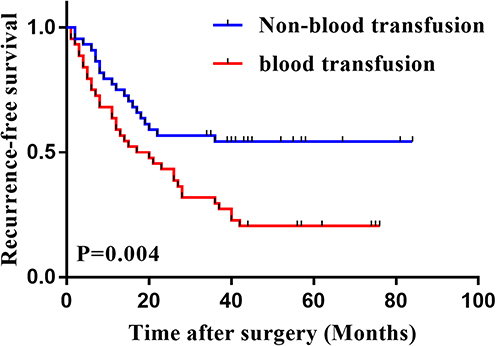
Figure 2 Kaplan–Meier curves for overall survival of blood transfusion and non-blood transfusion groups after PSM: >4 cm subset group.
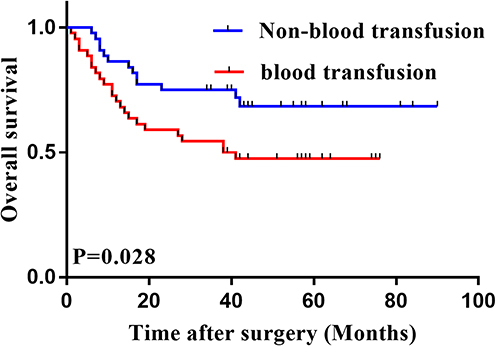
Figure 3 Kaplan–Meier curves for recurrence-free survival of blood transfusion and non-blood transfusion groups after PSM: ≤4 cm subset group.
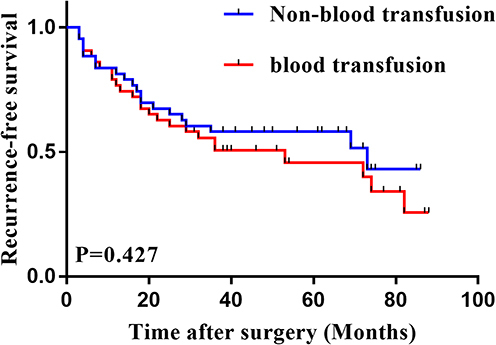
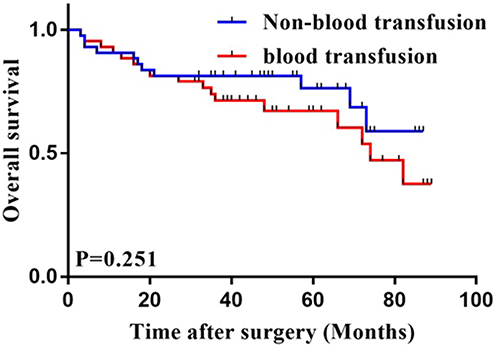
Figure 4 Kaplan–Meier curves for overall survival of blood transfusion and non-blood transfusion groups after PSM: ≤4 cm subset group.