Figures & data
Figure 1 Pathological and image findings of the patient on the first visit. (A) A chest CT scan on December 17, 2021 (A) revealed a soft tissue mass with a disrupted bronchus in the left lower hilar area. The mass had well-defined borders and measured approximately 2.9×1.3 cm with a CT value of approximately 46 Hounsfield units (HU). The arterial phase enhancement showed CT values of 105 HU and 122 HU, respectively. Atelectasis was observed in the left lower lobe. Multiple nodular opacities were found in both lungs, with miliary opacities and a larger opacity measuring approximately 0.7 cm in diameter in the right upper lung, showing spiculation and adjacent pleural traction. (B) A PET/CT scan on December 23, 2021 (B) showed increased FDG metabolism in a mass in the left lower hilar area with a maximum standardized uptake value (SUVmax) of 11.2, measuring 3.1×1 cm. This was suggestive of central-type lung cancer in the left lung with associated atelectasis in the left lower lobe. A small nodule measuring 0.8 cm in the right upper lobe showed increased FDG metabolism (SUVmax of 7.5). (C) depicts the pathological slide of the patient’s tumor tissue stained with hematoxylin and eosin. (×400).
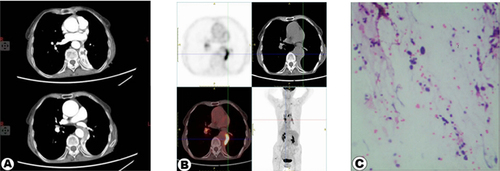
Figure 2 Illustrates the treatment process of the patient, including therapeutic medications and relevant examination results.
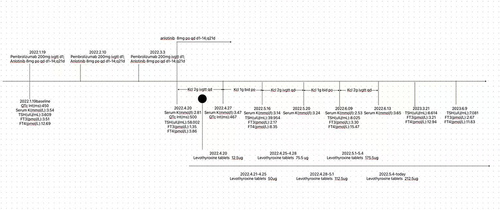
Figure 3 The image shows the lesion presentation on the same level of the patient’s follow-up CT scan. The upper half of each image shows the most prominent area of lung atelectasis (indicated by the red arrow), while the lower half of each image depicts the largest site of the lesion (marked by the red arrow). (A) The upper part was atelectatic, and the lower part was a tumorous. (B) Comparison of patients treated with pembrolizumab combined with anlotinib after one cycle. The scan revealed bilateral subpleural linear opacities, irregularity of the left lower lobar bronchus, multiple nodular opacities, and miliary opacities, with the largest one measuring approximately 0.7 cm in the right upper lobe, presenting spiculation and adjacent pleural traction. (C) The patients were re-examined eight months after the diagnosis of lung cancer. (D) The patients were re-examined twelve months after the diagnosis of lung cancer.
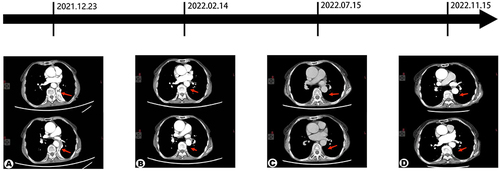
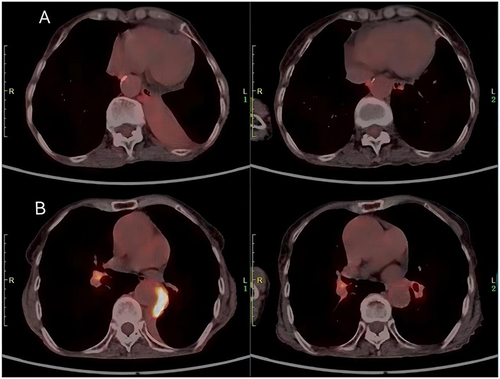
Figure 4 (A) This image shows the most severely compressed region of the lungs, with the left side depicting the PET/CT results obtained on December 23, 2021, and the right side displaying the PET/CT results obtained on June 9, 2023. (B) This image shows the area of highest metabolic activity in the lung lesions, with the left side showing the PET/CT results from December 23, 2021, and the right side showing the PET/CT results from June 9, 2023.