
Figures & data
Table 1 Patient Characteristics (n =115)
Figure 1 Overall survival in the EFRT and WPRT groups. Patients treated with EFRT had significantly better overall survival.
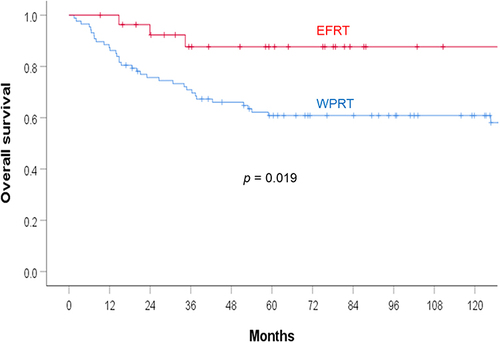
Figure 2 Pelvic recurrence rate in the EFRT and WPRT groups. The pelvic recurrence rate was not significantly different between the two groups.
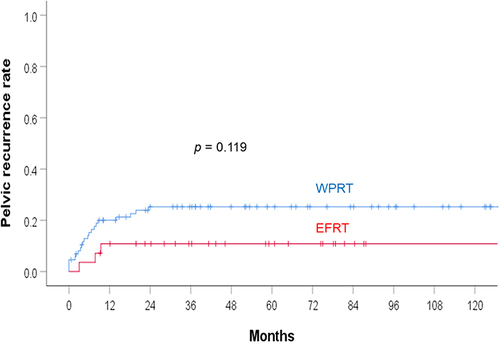
Figure 3 Extrapelvic recurrence rate in the EFRT and WPRT groups. Patients treated with EFRT have less extrapelvic recurrence.
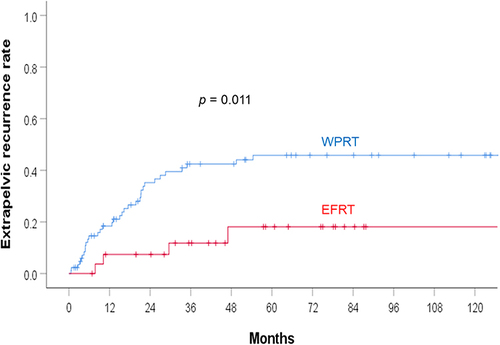
Figure 4 PALN recurrence rate in the EFRT and WPRT groups. EFRT significantly reduced the PALN recurrence rate.
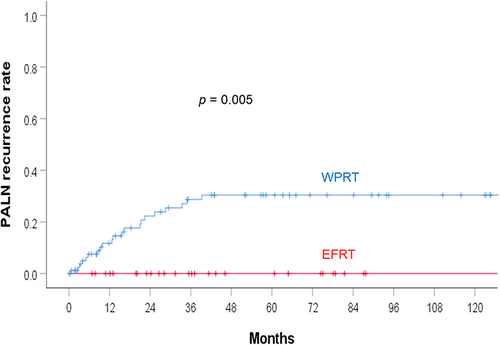
Table 2 Comparison of Treatment Outcomes Between FIGO 2018 IIIC1 Patients and Non-IIIC1 Patients
Table 3 Treatment Outcomes Between Patients with and without MRI Staging
Table 4 Multivariate Analysis of OS and EPR