Figures & data
Figure 1 AHNAK2 is highly expressed in PDAC and pancreatic cancer cell line. (A) Representative images of AHNAK2 immunohistochemical staining in normal non-tumor adjacent tissues and pancreatic ductal adenocarcinoma (PDAC) (scale bar, 50 µm). (B and C) qRT-PCR analysis of AHNAK2 mRNA in PDAC samples, non-tumor adjacent tissues (n=35), and pancreatic cancer cell line (n=3). (D) Representative images of AHNAK2 immunofluorescence staining in PANC-1 and hTERT-HPNE cells (scale bar, 50 µm). (E) The mRNA levels of AHNAK2 in normal tissues and PDAC tissues from The Cancer Genome Atlas (TCGA) and GTEx databases. (F) AHNAK2 mRNA levels by microarray analysis of PDAC samples and non-tumor normal tissues from TCGA and GEO (GSE15471) databases. The expression level of AHNAK2 was significantly positively correlated with both the overall survival (OS) and disease-free survival (DFS) of PDAC patients from TCGA and GTEx (G) and Kaplan-Meier plot database (H). Each bar represents Mean ± SD. *p<0.05, ***p<0.001.
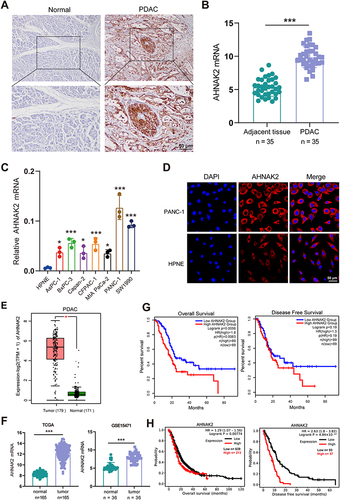
Figure 2 AHNAK2 knockdown inhibits proliferation, invasion, and migration in vitro. The expression levels of AHNAK2 in PANC-1 cells stably transfected with shRNA was analyzed by qRT-PCR (A), Western blot (B) and immunofluorescence staining (C). (D) Cell proliferation assay of shControl and AHNAK2 knockdown PANC-1 cells. The relative cell numbers on day 0 were arbitrarily set to 1 (n=5; only comparisons at 72h are shown). (E) Colony formation assay in shControl and AHNAK2 knockdown PANC-1 cells. (n=4). Silencing of AHNAK2 in PANC-1 cells significantly reduced their ability to invade in transwell assays (F) and migrate in wound healing assays (G) (n=5). Each bar represents Mean ± SD. *p<0.05; **p<0.01; ***p<0.001.
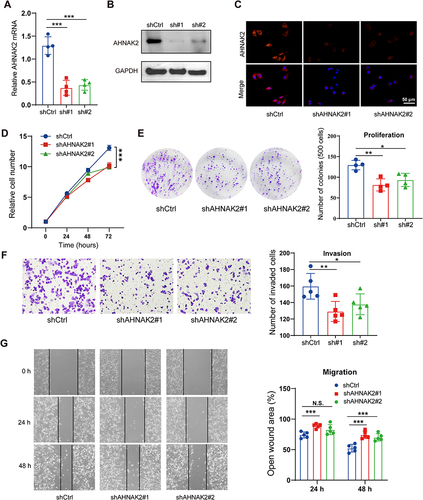
Figure 3 AHNAK2 promotes tumor growth and proliferation in CDX models. (A) Representative images of xenografts derived from PANC-1 cells stably transfected with shControl and shAHNAK2 groups. (B) After subcutaneous injection of shControl and AHNAK2 knockdown cells in mice, tumor growth curves were calculated at an interval of 6 days, showing that the growth of the shAHNAK2 group was inhibited. (C) Representative images of immunohistochemical staining of the proliferation marker Ki67 in the excised subcutaneous tumours (scale bar, 50 µm), and quantification of the percentage of Ki67 positive nuclei (n=5). Each bar represents Mean ± SD. *p<0.05; **p<0.01; ***p<0.001.
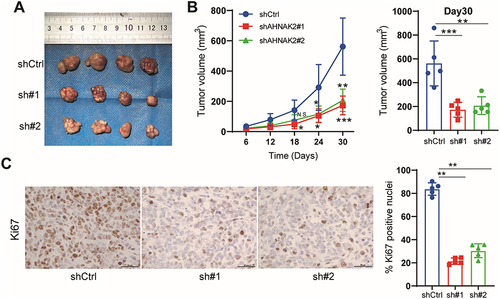
Figure 4 AHNAK2 knockout impairs tumorigenicity and progression in KPC mice. (A) Representative images of AHNAK2 immunohistochemical staining in the pancreas of wild type (WT), KPC and KPCAHNAK2−/− mice (scale bar, 50 µm). (B) qRT-PCR analysis of AHNAK2 mRNA expression in WT, KPC and KPCAHNAK2−/− mice (n=8). (C) Kaplan-Meier survival curves of KPC (n=13) and KPCAHNAK2−/− mice (n=10). (D) Pie charts represent the percentage of animals in each group that survived longer than 120 days (dark green). (E) Representative images of immunohistochemical staining of the proliferation marker Ki67 in the pancreatic tissues of WT, KPC and KPCAHNAK2−/− mice, and quantification of the nuclei positive for this marker (n=5 per genotype). Each bar represents Mean ± SD. **p<0.01; ***p<0.001.
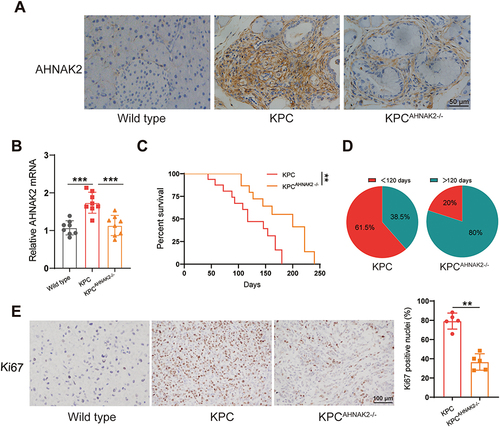
Figure 5 AHNAK2 expression is positively correlated with c-MET expression. (A) Correlation analysis of AHNAK2 and c-MET gene expression from GEPIA, Timer and Kaplan-Meier Plotter databases. (B) qRT-PCR analysis of AHNAK2 and c-MET mRNA expression in KPC (B) and KPCAHNAK2−/− mice (C). The mRNA levels of AHNAK2 and c-MET in KPC mice (D) and KPCAHNAK2−/− mice (E) are plotted for correlation analysis (n=8; Spearman correlation test). (F) Representative images of c-MET immunohistochemical staining in the pancreas tissue of WT, KPC and KPCAHNAK2−/− mice (scale bar, 50 µm). Each bar represents Mean ± SD. **p<0.01, p***<0.001.
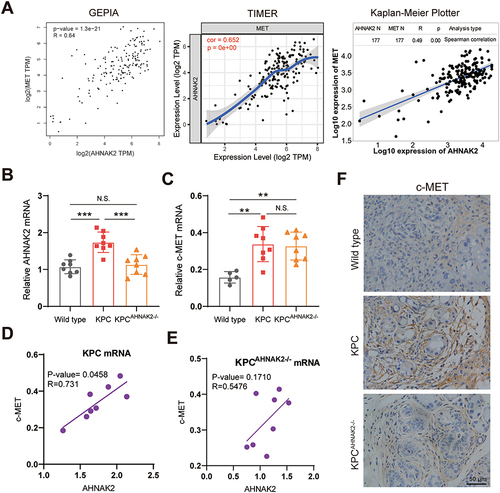
Figure 6 AHNAK2 correlates with c-MET expression in PDAC at protein level. (A) Representative immunohistochemical staining images of c-MET expression corresponding to high and low expression of AHNAK2 (AHNAK2High and AHNAK2Low) in PDAC specimens (n=10). (Scale bar, 100 µm). (B) Tumour samples were categorised according to AHNAK2 expression levels into high and low, according to the H-score, and rescored for c-MET. (C) Correlation analysis using the H-scores of AHNAK2 and c-MET (Spearman correlation test). Each bar represents Mean ± SD. *p<0.05.
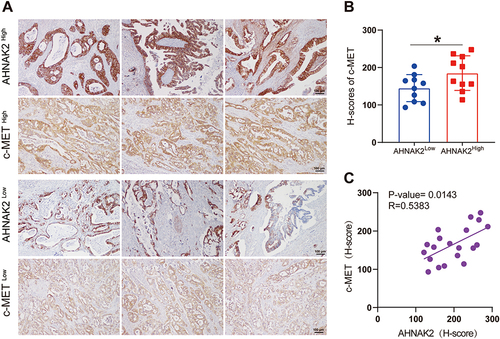
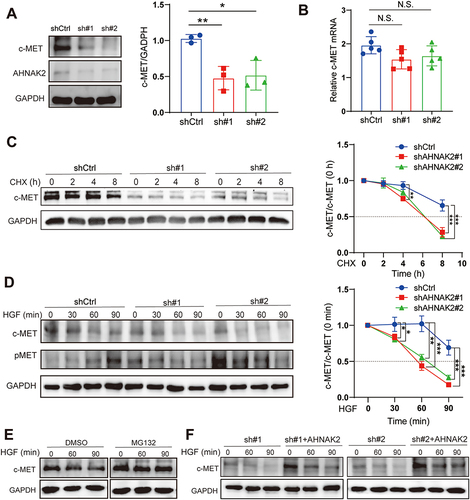
Figure 7 AHNAK2 stabilizes c-MET from degradation. (A) c-MET and AHNAK2 protein expression levels in PANC-1 cells of shAHNAK2 (n=3). (B) c-MET mRNA expression levels in PANC-1 cells of shControl and shAHNAK2 groups (n=5). (C) Representative Western blot images and degradation ratio curve of c-MET protein in shAHNAK2 PANC-1 cells after treated with cycloheximide at time gradients (n=3). (D) Representative Western blot images and time course of c-MET protein levels in shControl and shAHNAK2 PANC-1 cells in response to hepatocyte growth factor (HGF) stimulation (n=3). (E) HGF-induced c-MET accumulation in PANC-1 cells in the presence or absence of the proteasome inhibitor MG132 (n=3). (F) Rescue of AHNAK2 prevents c-MET from degradation. Representative Western blot image of c-MET levels in PANC-1 cells with shAHNAK2 or AHNAK2 re-expression. Each bar represents Mean ± SD. *p>0.05, **P>0.01; p***<0.001.