Figures & data
Figure 1 Patient recruitment and matching process.
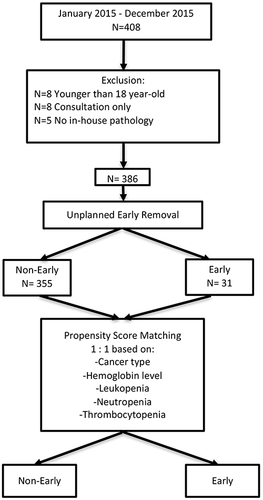
Table 1 Cohort and Matched Cohort Demographic Characteristics
Table 2 Adjusted Cox Proportional Hazard Analysis for Unplanned Early Catheter Removal
Figure 2 Kaplan-Meier catheter survival analysis. The median catheter survival for the early group was 65 days (95% CI 50.02–79.99) compared to 156 days (95% CI 42.92–269.09) for the non-early group, p = 0.021.
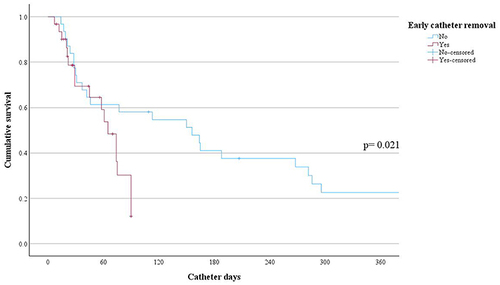
Figure 3 Effect of thrombocytopenia on catheter survival by Kaplan-Meier survival analysis. The median catheter survival for patients with thrombocytopenia was 61 days (95% CI 28.58–93.42) compared to 150 days (95% CI 9.81–290.19) for patients without thrombocytopenia, p= 0.015.
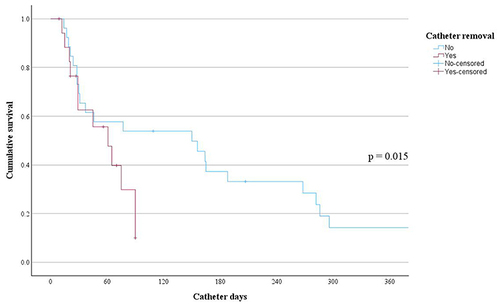
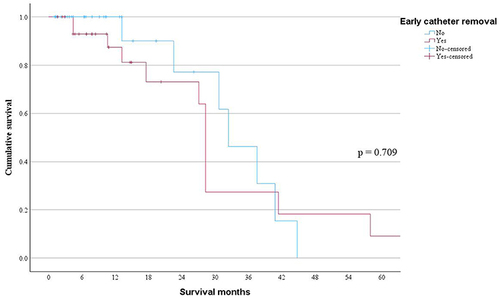
Figure 4 Effect of early unplanned catheter removal on patient survival. The median survival for the early group was 28.28 months (95% CI 27.43–29.15) compared to 32.39 (95% CI 24.11–40.68), for the non-early group, p=0.709.