Figures & data
Table 1 Clinicopathological Characteristics of the Training and Validation Groups
Figure 1 Patient selection flowchart.
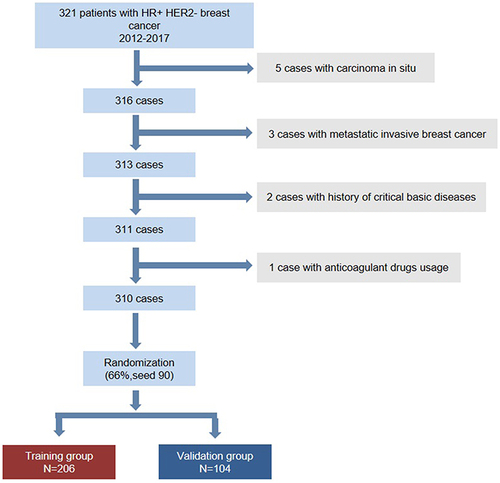
Table 2 Univariate and Multivariate Analyses of DFS in the Training Group
Figure 2 Nomogram for the prediction of DFS in HR+ HER2- breast cancer.
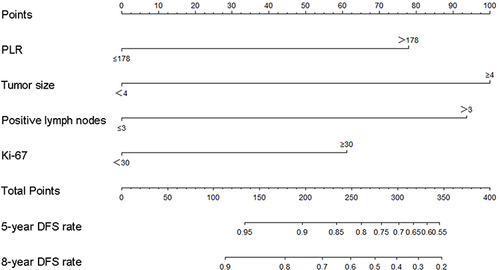
Figure 3 Calibration curves for predicting the DFS for patients with HR+ HER2- breast cancer in the training group at (A) 5 years and (B) 8 years and in the validation group at (C) 5 years and (D) 8 years. Nomogram-predicted probability is plotted on the x-axis and the actual survival is plotted on the y-axis.
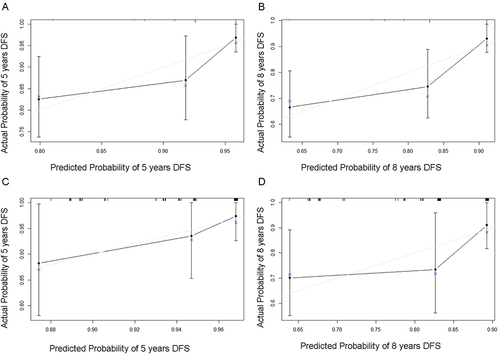
Figure 4 5 years (A) and 8 years (B) ROC curves for DFS.
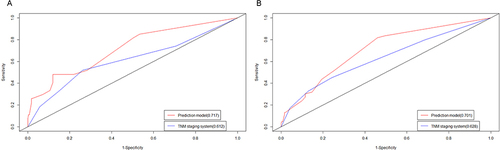
Table 3 Univariate Analyses of DFS by Total DFS Score
Figure 5 Risk group stratification in the total, training and validation group. DFS curves of patients in the total group (A), training group (B) and validation group (C) by nomogram score groups.
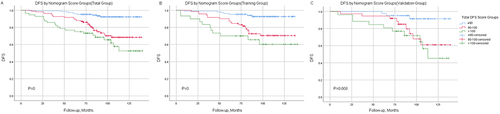
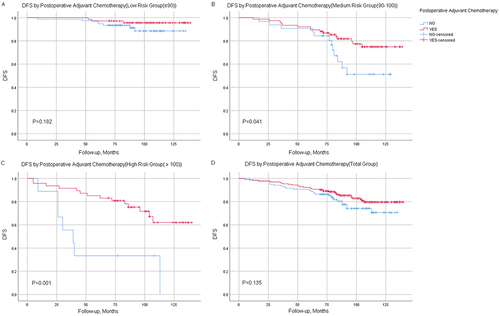
Table 4 Univariate Analyses of DFS in Different Risk Groups by Postoperative Adjuvant Chemotherapy
Figure 6 Risk group stratification in the low risk, medium risk, high risk and total group. DFS curves of patients in the low risk group (A), medium risk group (B), high risk group (C) and total group (D) by different postoperative adjuvant chemotherapy strategy.