
Figures & data
Figure 1 There were more adulterants in the thyroid gland, with disordered arrangement, some glands fused, and obvious cell atypia. The arrow indicates the heterocyst.
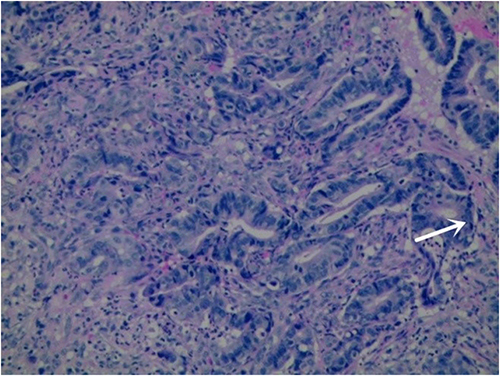
Figure 2 Immunohistochemistry revealed adenoid arrangement of heteromorphic cells with interstitial fibrosis. Immunohistochemistry revealed positive expression of CDX-2 (an intestinal specific transcription factor) and Villin, while negative expression of TG (thyroglobulin), suggesting a high possibility of intestinal metastatic adenocarcinoma. (A) The tumor cells (blue arrows) are adenoid and distributed in the thyroid tissue. And the thyroid follicles can be seen (red arrows); (B) The tumor cells were positive for CDX-2; (C) The tumor cells Villin were positive; (D) TG in thyroid follicles was positive and TG in tumor cells was negative.
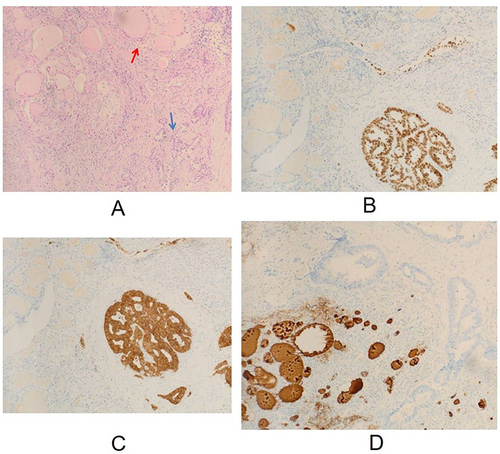
Figure 3 Heterotypic glands fused, partially ethmoidal, with marked interstitial fibrosis. The arrow indicates Cribriform heteromorphic cell fusion.
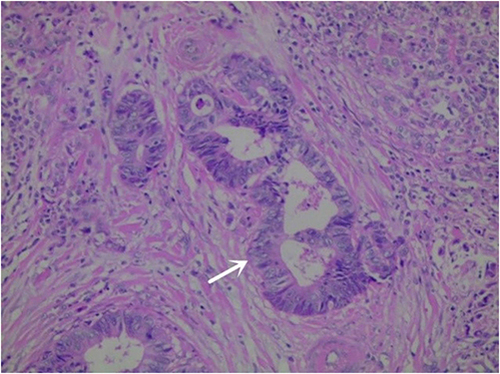
Figure 4 The 18F-FDG PET/CT scan images showing increased focal FDG uptake in the rectal mass and pelvic lymph nodes.
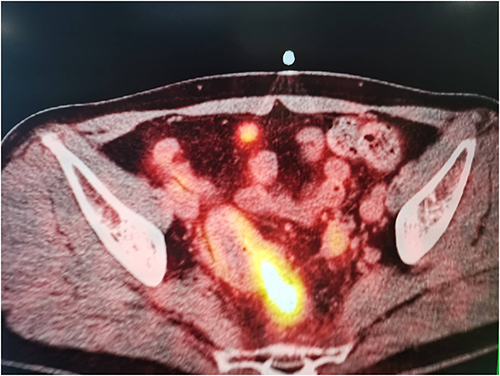
Figure 5 The FDG metabolism of multiple omentum nodules and pelvic peritoneal nodules which have unclear boundary with the anterior wall of rectum was increased.
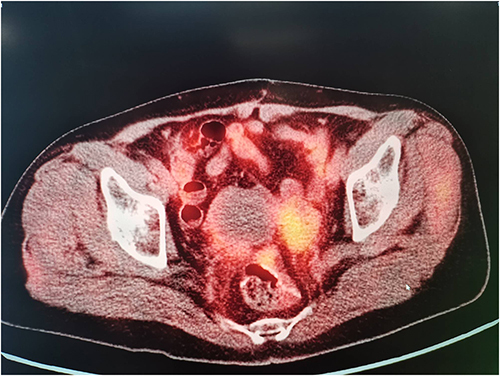
Table 1 Thirteen Cases of Thyroid Metastases from Colorectum, the Previously Reported Cases in the Literature
Data Sharing Statement
All data generated or analyzed during this study are included in this article.