Figures & data
Table 1 Articles included in this review
Figure 1 Surveillance, Epidemiology, End Results (SEER) data showing the change in 5-year survival of the most common cancer types from 1975 to 2011 in different age ranges among the AYA population.
Notes: Five-year relative survival for top five cancers by site for (A) 15- to 19-year olds, (B) 20- to 24-year olds, (C) 25- to 29-year olds, and (D) 30- to 34-year olds. Data from the website of the National Cancer Institute (http://www.cancer.gov).Citation43
Abbreviation: AYA, adolescent and young adult.
Abbreviation: AYA, adolescent and young adult.
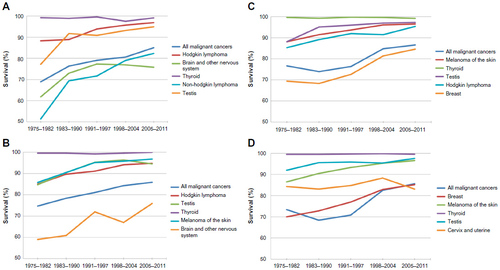
Figure 2 Trends in clinical trial enrollment of AYAs with cancer for the articles reviewed.Citation5,Citation7,Citation12,Citation21,Citation27
Notes: (A) Clinical trial enrollment of AYAs with all cancer (2002–2010). (B) Clinical trial enrollment for AYAs with bone and soft tissue tumors (1997–2010).
Abbreviation: AYA, adolescent and young adult.
Abbreviation: AYA, adolescent and young adult.
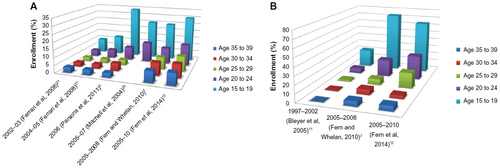
Figure 3 The 4 Ps Conceptual “Onion Skin” Model. This model demonstrates the different “layers”, which are the barriers to clinical trial enrollment of AYA patients.
Abbreviation: AYA, adolescent and young adult.
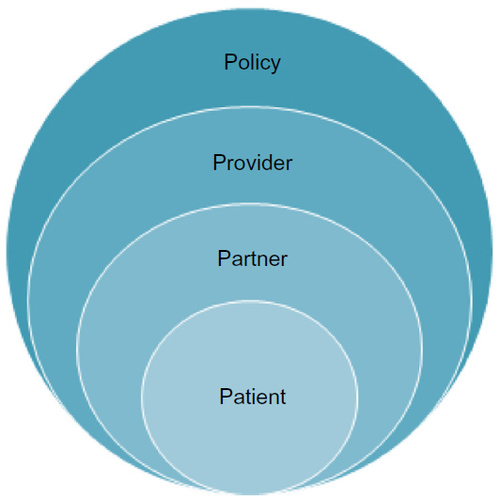
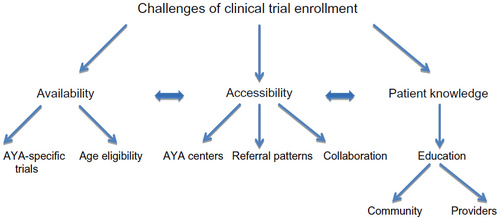
Figure 4 Proposed strategies to improve clinical trial enrollment of AYA patients.
Abbreviation: AYA, adolescent and young adult.