Figures & data
Figure 1 CS-exposed mice develop the hallmarks of COPD and skeletal muscle atrophy.
Notes: (A) Lung sections of the CS-group and control mice stained with H&E. (B) The MLI of the CS-group was significantly higher than that of the control group. (C) The MAN of the CS-group was significantly lower than that of the control group. (D) The airway resistance of the CS-group was significantly higher than that of the control group. (E) The dynamic lung compliance of the CS-group was significantly lower than that of the control group. (F) After 24 weeks of CS exposure, the body weight of the CS-group mice was significantly lower than that of the control group mice. (G) Quadriceps muscle sections stained with H&E. (H) Muscle fiber cross-sectional area in the CS-group was significantly lower than that in the control group. (I) The number of muscle fiber cells per LP of the CS-group was significantly higher than that of the control group. The values are shown as mean ± SEM (n= five per group). *P<0.05, **P<0.001 compared with the control group.
Abbreviations: cdyn, dynamic lung compliance; Ctrl, control; CS, cigarette smoke; CSA, cross-sectional area; H&E, hematoxylin and eosin; MLI, mean linear intercept; MAN, mean alveolus number; LP, low-power field; SEM, standard error of mean.
Abbreviations: cdyn, dynamic lung compliance; Ctrl, control; CS, cigarette smoke; CSA, cross-sectional area; H&E, hematoxylin and eosin; MLI, mean linear intercept; MAN, mean alveolus number; LP, low-power field; SEM, standard error of mean.
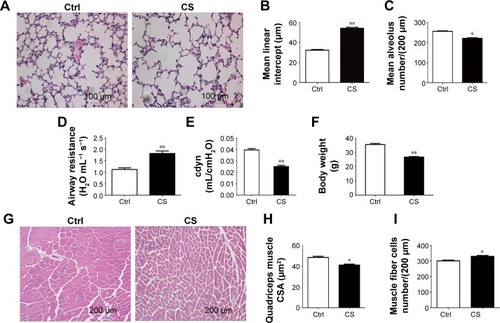
Figure 2 SRF expression and subcellular redistribution.
Notes: (A) The cytosolic and nuclear fractions were harvested and subjected to Western blot analysis to examine the subcellular localization of SRF. Beta-tubulin and histone H3 were included as an internal control for the cytosol and nuclear fraction, respectively. The protein level of SRF in the cytosolic fraction was greater in the quadriceps muscle of CS-group mice than in that of control mice; conversely, in the nuclear fraction it was lower in the CS-group compared with controls. Accordingly, immunofluorescence indicated fewer SRF-positive nuclei in the muscle fibers in CS-group mice and more SRF in the cytosol compared with the control group. (B) The amount of SRF protein and mRNA in the whole quadriceps tissue was not significantly different between the two groups. The values are shown as mean ± SEM (n= four per group). **P<0.001 compared with the control group.
Abbreviations: CS, cigarette smoke; Ctrl, control; DAPI, 4′,6-diamidino-2-phenylindole; GAPDH, glyceraldehyde 3-phosphate dehydrogenase; mRNA, messenger RNA; SRF, serum response factor; SEM, standard error of mean.
Abbreviations: CS, cigarette smoke; Ctrl, control; DAPI, 4′,6-diamidino-2-phenylindole; GAPDH, glyceraldehyde 3-phosphate dehydrogenase; mRNA, messenger RNA; SRF, serum response factor; SEM, standard error of mean.
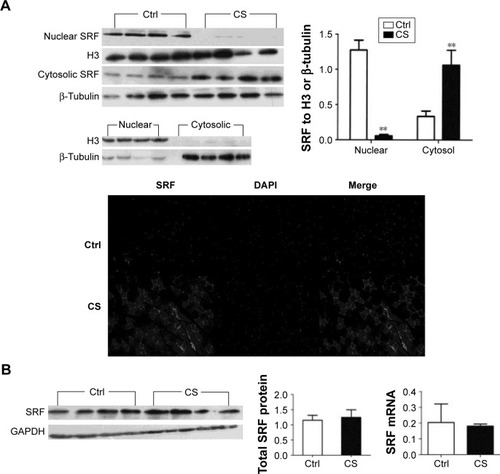
Figure 3 Reduced mRNA levels of Igf1, Acta1, and Myh2 mRNA in CS-exposed mice.
Notes: The mRNA levels of Igf1, Acta1, and Myh2 were quantified in the quadriceps muscle of control and CS-group mice by real-time reverse transcription polymerase chain reaction. The levels of IGF1 mRNA were decreased by 97% in CS-group mice compared with controls. The mRNA levels of Acta1 and Myh2 were reduced in the CS-group compared with the control group, but the difference was not significant. The values are shown as mean ± SEM (n= four per group). *P<0.05 compared with the control group.
Abbreviations: CS, cigarette smoke; Ctrl, control; mRNA, messenger RNA; SEM, standard error of mean.
Abbreviations: CS, cigarette smoke; Ctrl, control; mRNA, messenger RNA; SEM, standard error of mean.
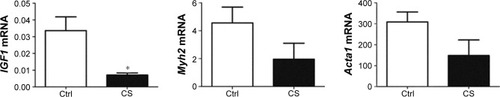
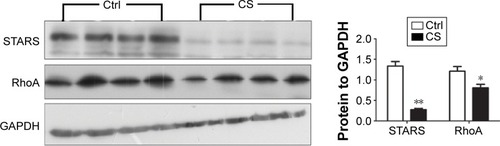
Figure 4 The expression of STARS and RhoA protein in CS-exposed and control mice.
Notes: Western blot analysis showed that the protein levels of STARS and RhoA in the quadriceps muscle of CS-group mice were markedly lower than those in the control group. Densitometric analysis showed the amount of STARS and RhoA in the quadriceps muscle of CS-group mice to be 79% and 50% lower than that in control mice, respectively. The protein levels of STARS and RhoA were normalized to those of GAPDH protein. The values are shown as mean ± SEM (n=4 per group). *P<0.05, **P<0.001 compared with the control group.
Abbreviations: CS, cigarette smoke; Ctrl, control; GAPDH, glyceraldehyde 3-phosphate dehydrogenase; RhoA, ras homolog gene family, member A; STARS, striated muscle activator of Rho signaling; SEM, standard error of mean.
Abbreviations: CS, cigarette smoke; Ctrl, control; GAPDH, glyceraldehyde 3-phosphate dehydrogenase; RhoA, ras homolog gene family, member A; STARS, striated muscle activator of Rho signaling; SEM, standard error of mean.