Figures & data
Table 1 Respimat inhaler, Breezhaler, Genuair, and Ellipta
Figure 1 Air flow characteristics of marketed inhalers.
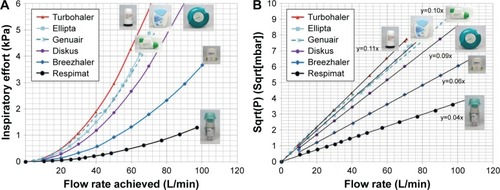
Figure 2 Impactor measurement.
Notes: Setup consisting of Alberta throat model, mixing inlet, lung simulator, and NGI. For aqueous aerosol (Respimat) the feed air was humidified (RH >95%) in order to avoid artificial particle shrinking inside the impactor. For dry powders, ambient nonhumidified air was used, which had a relative humidity of 40%–50%.
Abbreviations: ASL, active servo lung; NGI, next generation impactor; RH, relative humidity.
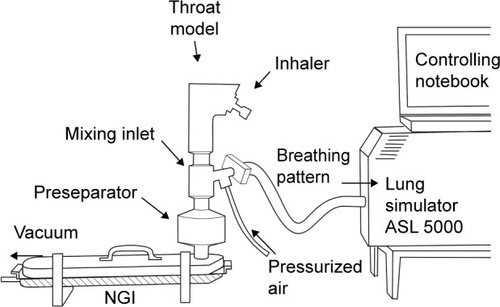
Figure 3 Filter measurement.
Abbreviation: ASL, active servo lung.
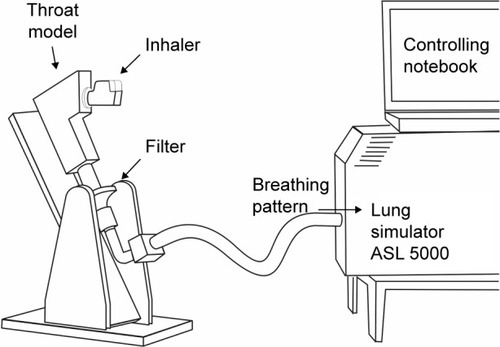
Figure 4 Inhalation flow profiles.
Abbreviation: COPD, chronic obstructive pulmonary disease.
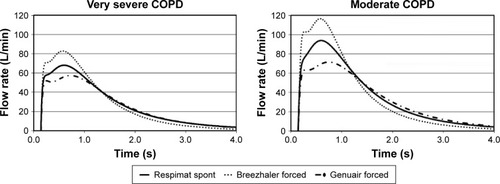
Figure 5 Cumulative lung volume of the air ducts in the present simulation model, of the theoretical calculated volume and of the volume provided by Finlay including alveoles as a function of the airway generation.
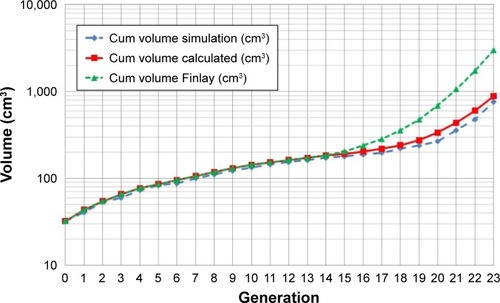
Figure 6 Visual appearance of the computer mesh used for the CFD calculation.
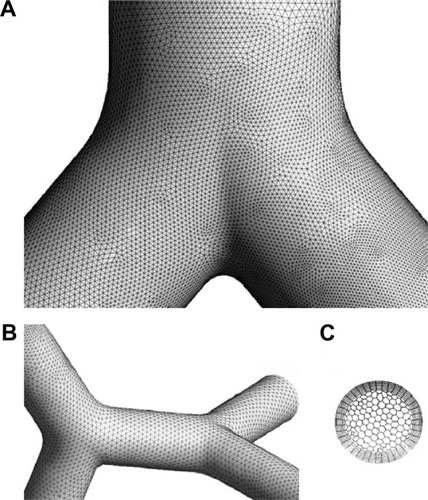
Table 2 Results of all filter and NGI measurements
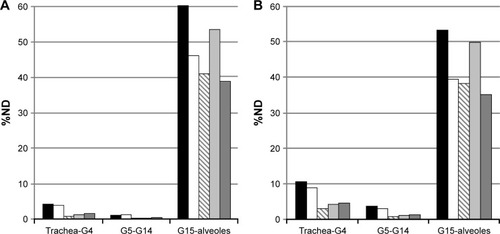
Figure 7 Modeled dose to the lung determined using the NGI setup (applied for very severe COPD breathing pattern) and the filter setup (for moderate COPD breathing pattern).
Abbreviations: COPD, chronic obstructive pulmonary disease; ND, nominal dose; NGI, next generation impactor.
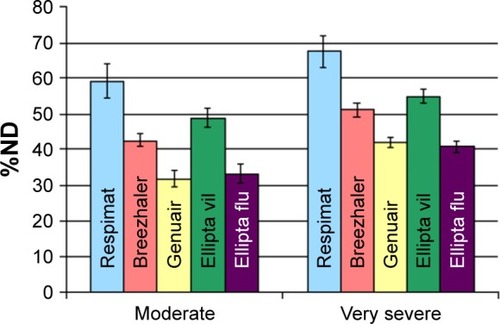
Figure 8 Particle deposition results of CFD simulations and receptor densities.
Abbreviations: API, active pharmaceutical ingredient; CFD, computational fluid dynamics.
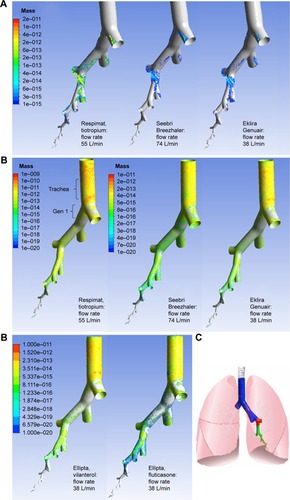
Figure 9 CFD simulation results, (A) laminar model, (B) turbulent model.
Abbreviations: CFD, computational fluid dynamics; ND, nominal dose.