
Figures & data
Table 1 Descriptive characteristics of the study population
Figure 1 Distribution of VOCs according to the residence type.
Abbreviation: VOCs, volatile organic compounds.
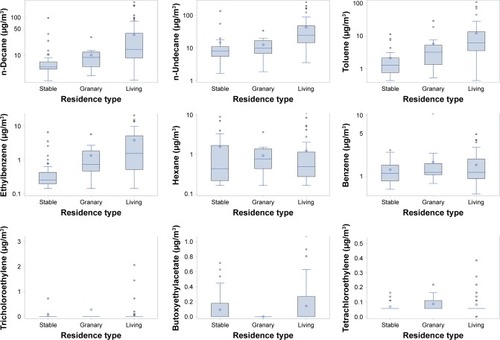
Figure 2 Distribution of the global VOC scores in the farms.
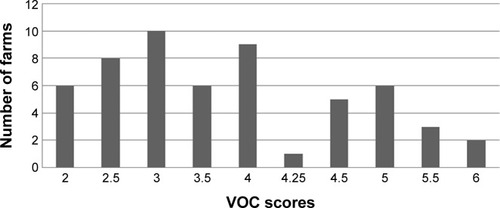
Figure 3 Distribution of PM2.5 according to the residence type.
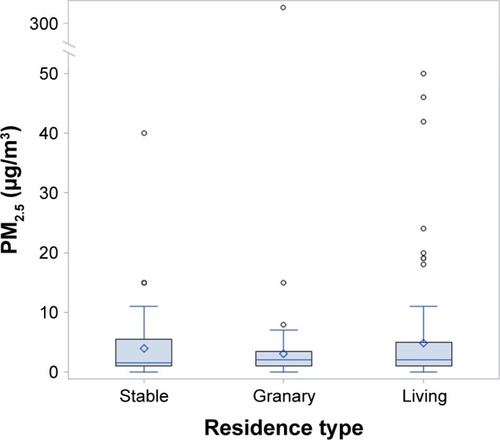
Figure 4 Distribution rate of each cytokine and ILs.
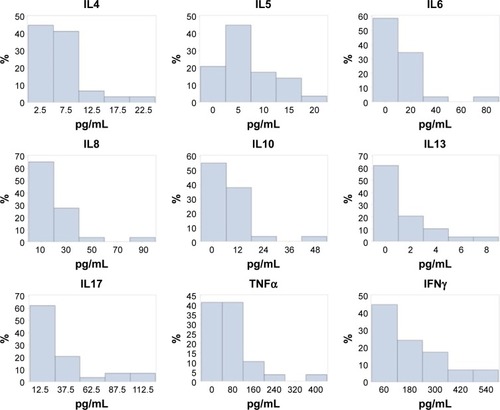
Table 2 Association between IL/cytokine concentrations and respiratory symptoms and diseases
Table 3 Association between exposure to VOC and cytokine levels
Table 4 Results of linear regression models before and after adjustment for potential cofounders of the association between exposure to PM2.5 and cytokine levels
Table S1 Distribution of volatile organic compounds in all farms
Table S2 Distribution of PM2.5 in all farms