
Figures & data
Figure 1 Flow diagram of the study.
Abbreviations: FEV1, forced expiratory volume in the first second of expiration; FVC, forced vital capacity; LDCT, low-dose computed tomography.
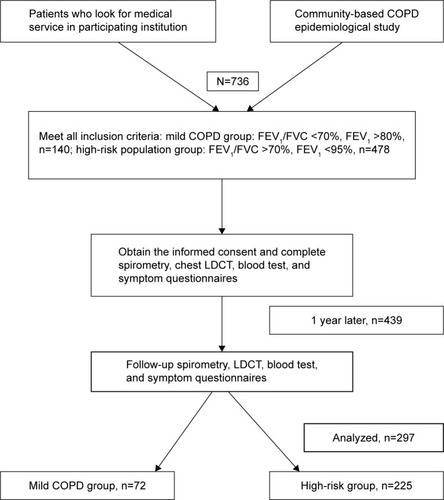
Figure 2 The change in FEV1 between baseline and the first-year follow-up.
Abbreviation: FEV1, forced expiratory volume in the first second of expiration.
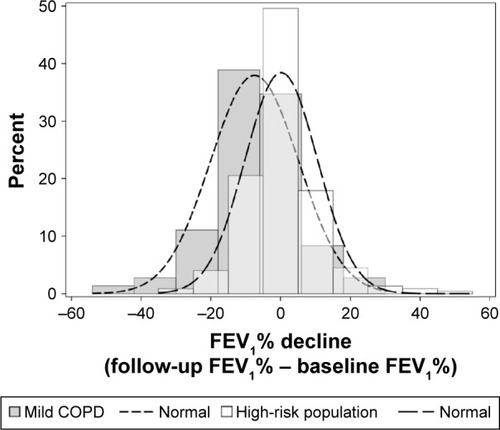
Table 1 Patient demographics and baseline characteristics
Table 2 The factors influencing FEV1% predicted decline in the mild COPD group
Table 3 The factors influencing FEV1% predicted decline in the high-risk group
Table 4 Cytokine levels in the fast-decline and slow-decline groups