Figures & data
Table 1 Characteristic features of the study groups
Table 2 Clinical and functional characteristics of the infrequent versus frequent exacerbator COPD patients
Table 3 Clinical and functional characteristics of the COPD patients with and without exacerbations requiring hospitalization
Table 4 Univariable and multivariable analysis of possible risk factors for exacerbation requiring hospitalization in the previous year
Table 5 Univariate correlations (r) between serum CCL-18 level and frequency of exacerbations, frequency of exacerbations requiring hospitalization, airflow limitation, dyspnea perception, total symptom scores, 6-min walking distance, BODE index, and comorbidities in the COPD group (n=60)
Figure 1 Comparison of serum CCL-18 concentration of infrequent exacerbator COPD patients with frequent exacerbator COPD patients. The central horizontal line on each box represents the median, the ends of the boxes are 25 and 75 percentiles and the error bars 5% and 95%. P-values derived from the Mann–Whitney U-test.
Abbreviations: COPD, chronic obstructive pulmonary disease; IE-COPD, infrequent exacerbator chronic obstructive pulmonary disease patients; FE-COPD, frequent exacerbator chronic obstructive pulmonary disease patients.
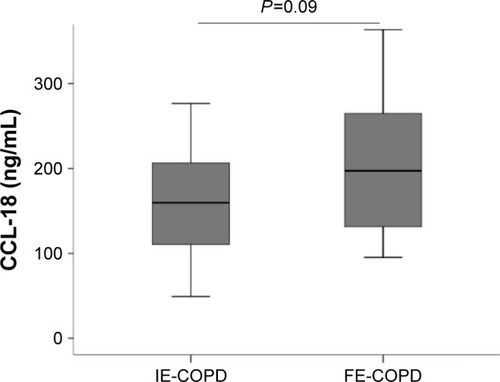
Figure 2 Comparison of serum CCL-18 concentration in COPD patients with ≥1 hospitalized exacerbations and those who were not hospitalized. The central horizontal line on each box represents the median, the ends of the boxes are 25 and 75 percentiles and the error bars 5% and 95%. P-values derived from the Mann–Whitney U-test.
Abbreviations: CCL-18, chemokine (C-C motif) ligand 18; COPD, chronic obstructive pulmonary disease.
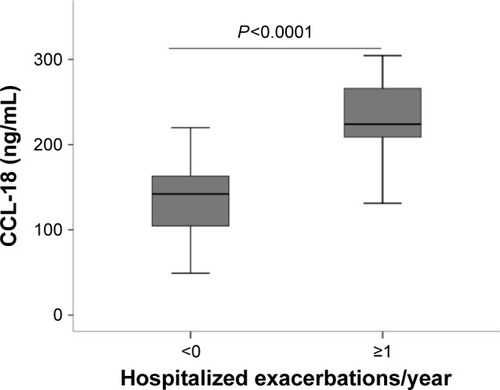
Figure 3 Receiver operator characteristic curve distinguishing COPD patients and smokers with normal spirometry AUC: 0.86 (95% CI: 0.77–0.94). The cutoff that maximizes the sum of sensitivity (83.1%) and specificity (73.7%) was >105.76 ng/mL.
Abbreviations: ROC, receiver operating characteristics curve anlaysis; CCL-18, chemokine (C-C motif) ligand 18; AUC, area under curve; CI, confidence intervals.
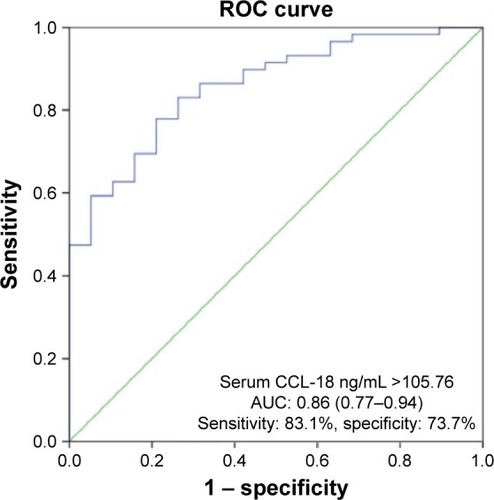
Figure 4 Receiver operator characteristic curve distinguishing COPD patients with hospitalized exacerbations from those who were not hospitalized, AUC: 0.92 (95% CI: 0.85–0.99). The cutoff that maximizes the sum of sensitivity (88%) and specificity (88.2%) was >108.71 ng/mL.
Abbreviations: ROC, receiver operating characteristics curve anlaysis; CCL-18, chemokine (C-C motif) ligand 18; AUC, area under curve; CI, confidence intervals.
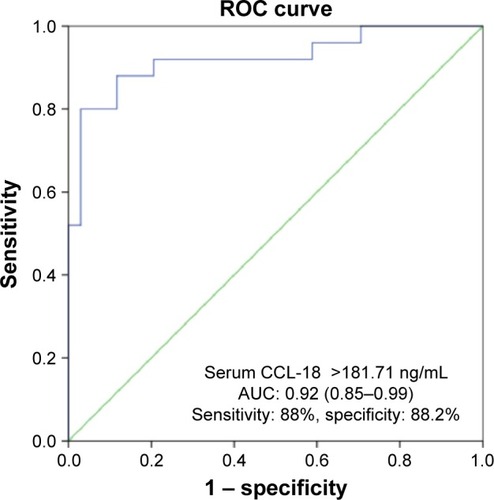
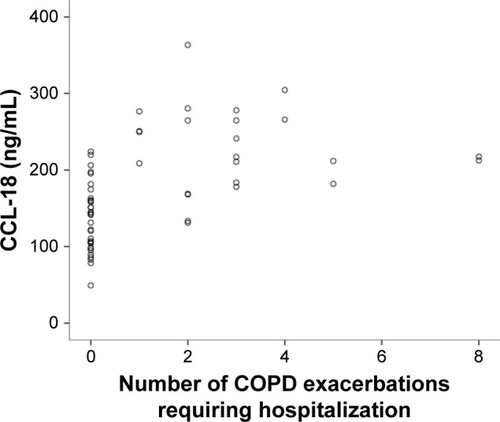
Figure 5 Scatterplot graph of serum CCL-18 concentration with number of exacerbations requiring hospitalization in COPD group.