Figures & data
Table 1 Subject characteristics
Table 2 Univariate associations (Pearson’s correlation coefficient) between brachial intima-media thickness and characteristics of patients with COPD and the complete sample
Figure 1 B-IMT in patients with stable COPD (n=60) versus smoking (n=20) and nonsmoking controls (n=20).
Abbreviations: COPD, chronic obstructive pulmonary disease; B-IMT, brachial intima-media thickness.
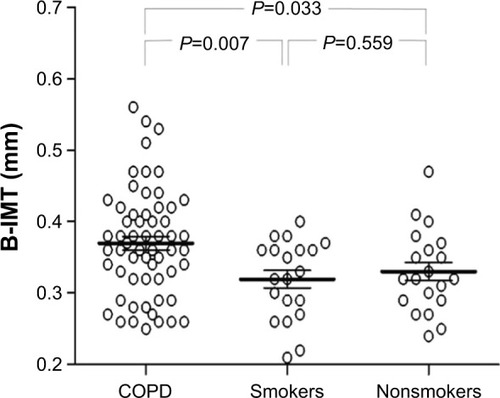
Figure 2 10-year risk for cardiovascular events expressed as Framingham risk score in COPD patients above (n=39) and below (n=21) the suggested reference value for B-IMT (0.345 mm).
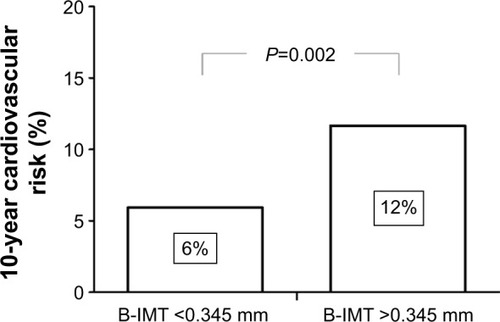
Figure 3 Linear regression analysis between B-IMT and interleukin-6 in patients with COPD (n=60).
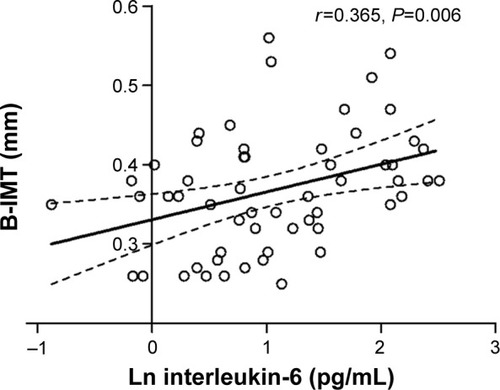
Table 3 Independent predictors of brachial intima-media thickness in patients with COPD
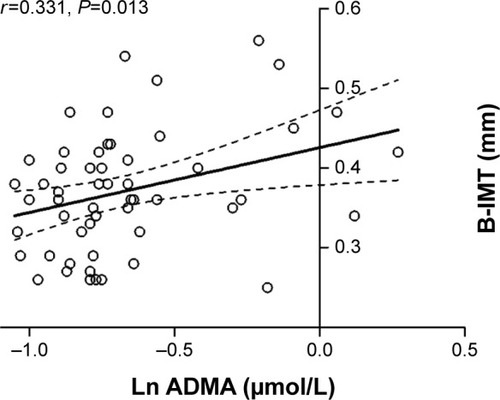
Figure 4 Linear regression analysis between ADMA and B-IMT in patients with COPD (n=60).