Figures & data
Table 1 Patient characteristics
Table 2 The different ventilatory settings investigated and the breathing frequency adopted by the patients
Table 3 EMG activity per breath (average over 10 breaths) and total EMG activity in 1 min during the spontaneous breathing period before the NIV setting and during the selected NIV settings
Figure 1 EMG activity ratios (EMGARs) with the different settings are shown per breath (A) and per minute (B).
Abbreviations: EMG, electromyography; LPLF, low-pressure, low-frequency setting; HPLF, high-pressure, low-frequency setting; LPHF, low-pressure, high-frequency setting; HPHF, high-pressure, high-frequency setting; NIV, noninvasive ventilation.
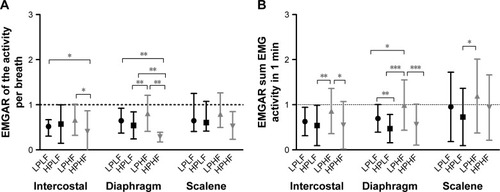
Table 4 Patient-ventilator asynchrony during different settings
Figure 2 Transcutaneous carbon dioxide pressure (PtCO2) during spontaneous breathing and with the different settings.
Abbreviations: LPLF, low-pressure/low-frequency setting; HPLF, high-pressure/low-frequency setting; LPHF, low-pressure/high-frequency setting; HPHF, high-pressure/high-frequency setting.
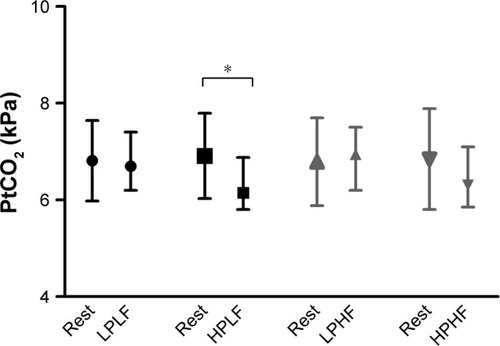
Figure 3 Reproducibility of the EMG of the intercostal muscles (A), diaphragm (B), and scalene muscles (C).
Abbreviations: EMG, electromyography; EMGAR, EMG activity ratio; LPLF, low-pressure/low-frequency setting; HPLF, high-pressure/low-frequency setting; LPHF, low-pressure/high-frequency setting; HPHF, high-pressure/high-frequency setting.
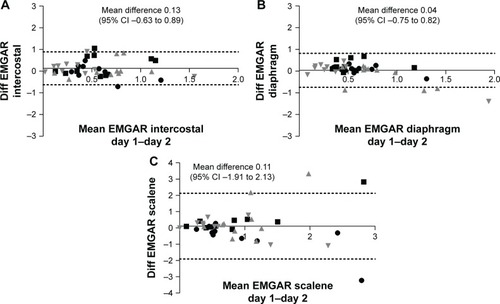
Figure S1 The QRS removal process.
Notes: The averaged EMG (EMGa) shows respiratory activity. As control the signal from the abdominal magnetometer band (Band) is shown. From the diaphragmatic EMG signal (EMGd), the QRS complex was detected and stretched into a standard QRS pulse with a duration of 100 ms (QRS). During the QRS pulse a cut was made in the slightly delayed (40 ms) EMG signal to completely filter out the QRS complex (EMGg). Next, the gated EMG was rectified and averaged with a moving time window of 200 ms. Finally, the missing signal in the gate was filled with the running average resulting in a fairly good interpolation during the gate and an almost QRS-free averaged EMG signal (EMGa).
Abbreviation: EMG, electromyography.
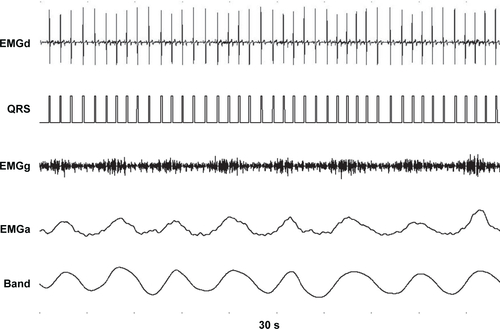
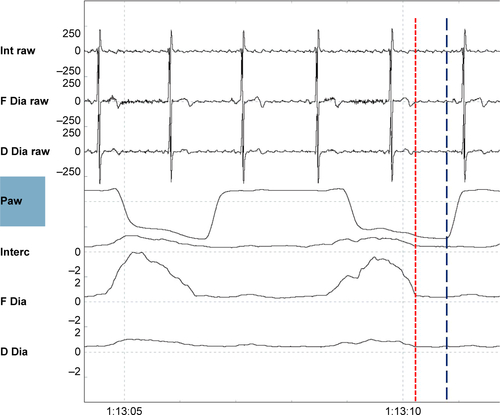
Figure S2 A pressure-supported (PS) breath.
Notes: Shown are (from top to bottom) the raw intercostal signal (Int raw), the raw frontal diaphragm signal (F Dia raw), the raw dorsal diaphragm signal (D Dia raw), the pressure wave (Paw), the average intercostal signal (Interc), the average frontal diaphragm (F Dia) signal, and the average dorsal diaphragm signal (D Dia). Two PS breaths are shown, as electromyography activity (the dotted red line) precedes the pressure wave (the straight blue line). A low backup frequency of 10 breaths/min was set on the ventilator, therefore a 2.6 s time in-between the breaths confirms that breaths were PS and not pressure-controlled (PC).
Abbreviation: EMG, electromyography.
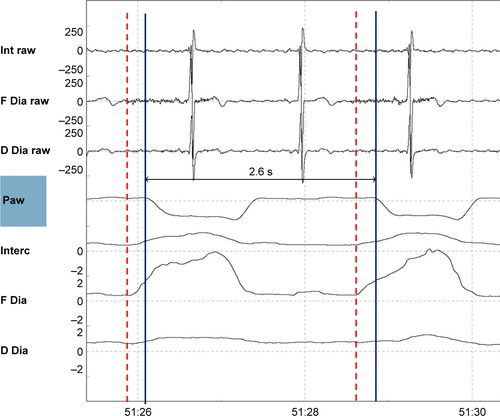
Figure S3 A pressure-controlled (PC) breath.
Notes: Shown are (from top to bottom) the raw intercostal signal (Int raw), the raw frontal diaphragm signal (F Dia raw), the raw dorsal diaphragm signal (D Dia raw), the pressure wave (Paw), the average intercostal signal (Interc), the average frontal diaphragm (F Dia) signal, and the average dorsal diaphragm signal (D Dia). Two PC breaths are shown, electromyography activity (the dotted red line) appears but after the pressure wave (the straight blue line) started. This is a tracing during a high-pressure, high-frequency setting, with a backup frequency of 22 breaths/min, so that an in-between breath time of 2.7 s means that the ventilator delivers a breath at the moment it is supposed to do according to the set-up backup frequency. Of note, electromyography activity was much lower with this setting.
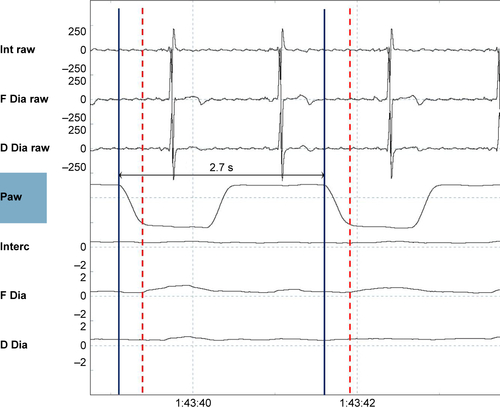
Figure S4 An ineffective effort.
Notes: Shown are (from top to bottom) the raw intercostal signal (Int raw), the raw frontal diaphragm signal (F Dia raw), the raw dorsal diaphragm signal (D Dia raw), the pressure wave (Paw), the average intercostal signal (Interc), the average frontal diaphragm (F Dia) signal, and the average dorsal diaphragm signal (D Dia). An electromyography signal (dotted red line) was not followed by a breath delivered by the ventilator (straight arrow blue line).
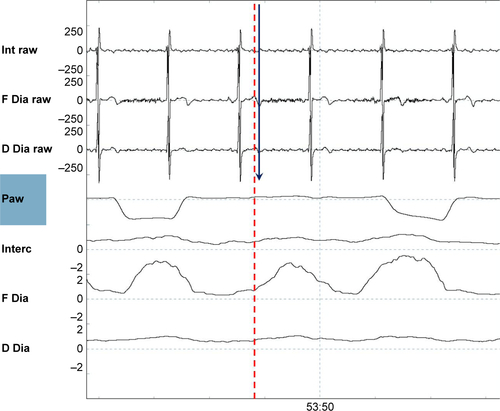
Figure S5 Autotriggering.
Notes: Shown are (from top to bottom) the raw intercostal signal (Int raw), the raw frontal diaphragm signal (F Dia raw), the raw dorsal diaphragm signal (D Dia raw), the pressure wave (Paw), the average intercostal signal (Interc), the average frontal diaphragm (F Dia) signal, and the average dorsal diaphragm signal (D Dia). During this low-frequency setting (backup frequency 10 breaths/min), the two breaths denoted by arrows come too soon to be PC. As it is not preceded by EMG activity, these are defined as inappropriate autotriggered breaths (straight blue lines).
Abbreviations: EMG, electromyography; PC, pressure-controlled.
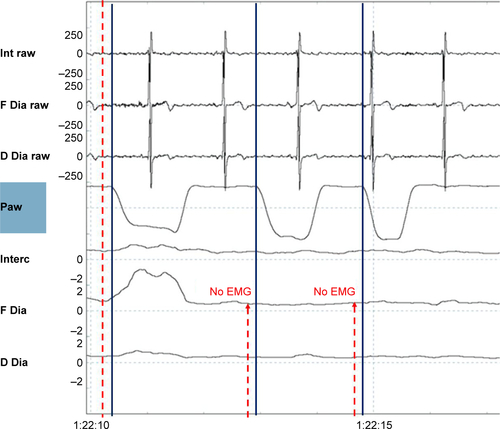
Figure S6 Double triggering.
Notes: Shown are (from top to bottom) the raw intercostal signal (Int raw), the raw frontal diaphragm signal (F Dia raw), the raw dorsal diaphragm signal (D Dia raw), the pressure wave (Paw), the average intercostal signal (Interc), the average frontal diaphragm (F Dia) signal, and the average dorsal diaphragm signal (D Dia). A single electromyography wave (dotted red line) is followed by two ventilator delivered breaths (nr.1 and nr.2 straight blue lines).
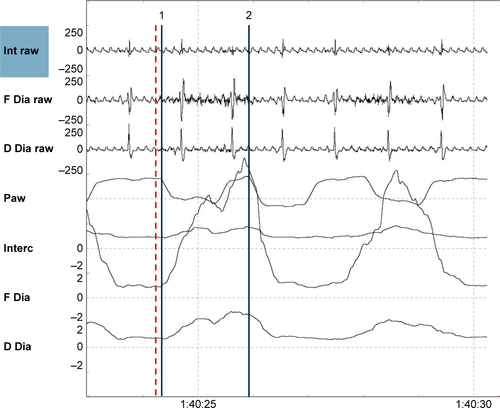
Figure S7 Premature cycling.
Notes: Shown are (from top to bottom) the raw intercostal signal (Int raw), the raw frontal diaphragm signal (F Dia raw), the raw dorsal diaphragm signal (D Dia raw), the pressure wave (Paw), the average intercostal signal (Interc), the average frontal diaphragm (F Dia) signal, and the average dorsal diaphragm signal (D Dia). Electromyography activity (the maximum of the electromyography is depicted by the red dotted line) continues, while the pressure returns to baseline again (the end of the inspiratory pressure delivering is depicted by the blue dotted line).
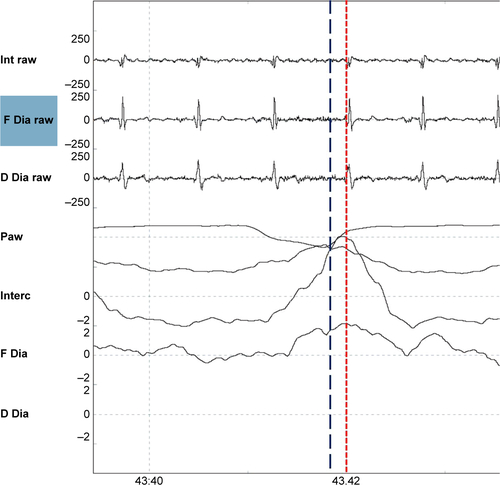
Figure S8 Delayed cycling.
Notes: Shown are (from top to bottom) the raw intercostal signal (Int raw), the raw frontal diaphragm signal (F Dia raw), the raw dorsal diaphragm signal (D Dia raw), the pressure wave (Paw), the average intercostal signal (Interc), the average frontal diaphragm (F Dia) signal, and the average dorsal diaphragm signal (D Dia). The electromyography activity has already ceased (end of the electromyography activity depicted by the red dotted line), while the pressure wave continues, (end of the breaths depicted by the straight blue line).