
Figures & data
Table 1 Patient characteristics
Table 2 Result from the questionnaire
Figure 1 Histogram showing over swallowing capacity where the lower normal reference value for 150 mL of water is 10 mL/sec (≤15 seconds).
Note: The y-axis indicates the number of patients.
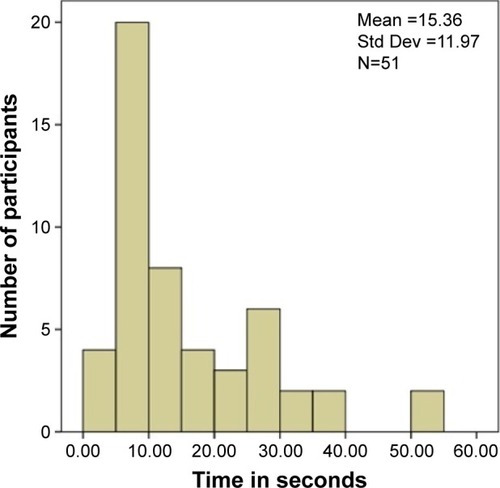
Table 3 Results from the questionnaire and swallowing tests expressed in number of symptoms according to lung function
Figure 2 Scatterplot where the y-axis shows lung function expressed in FEV1%, and the x-axis shows number of dysphagia symptom(s): subjective and objective symptoms.
Abbreviation: FEV1, forced expiratory volume in 1 second.
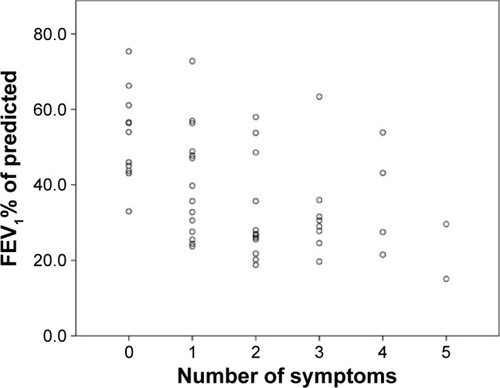
Table 4 Number of participants according to GOLD stage based on lung function (FEV1%) and gender ratio