Figures & data
Table 1 Monitors’ technical characteristics
Table 2 Protocol followed to assess BR variations during the phase 1 of the study
Table 3 Patients characteristics
Table 4 Bias and limits of agreement of the five monitors
Figure 1 Validation of BR in a laboratory setting for five monitors.
Notes: Bland and Altman plots between Oxicon® BR output and different monitors BR outputs. Solid lines represent the bias, and dotted lines represent 95% limits of prediction.
Abbreviations: Accel, accelerometer; bpm, breath per minute; BR, breathing rate; PPG, photoplethysmography.
Abbreviations: Accel, accelerometer; bpm, breath per minute; BR, breathing rate; PPG, photoplethysmography.
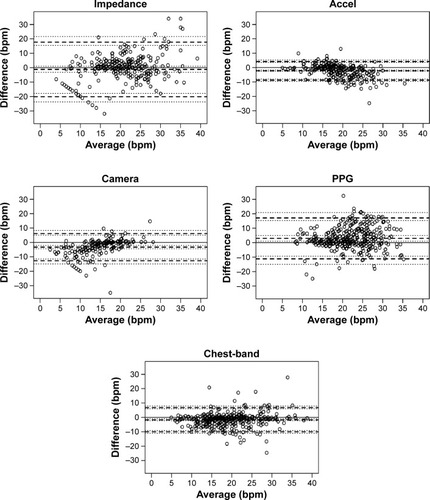
Figure 2 Plots of the mean Oxicon® BR output against the mean output for the other monitors when comparing resting (sitting) with combined activities (fast 6MWT, slow 6MWT, sweeping, and lifting).
Abbreviations: 6MWT, 6 minute walking test; bpm, breath per minute; PPG photoplethysmography; BR, breathing rate.
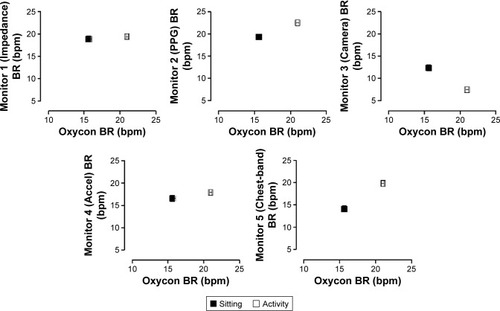
Figure 3 Evolution of BR shows the overall patient evolution of the BR during the recovery.
Abbreviation: BR, breathing rate.
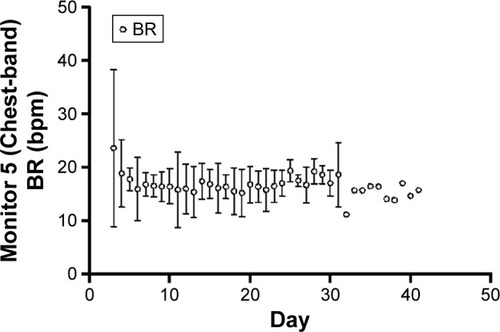
Figure 4 Example of patients during the monitoring period.
Notes: Panel (A) shows patients 6 and 9 who showed improvements during the recovery process in BR and Panel (B) is an example of a patient who did not show improvements.
Abbreviations: bpm, breath per minute; BR, breathing rate.
Abbreviations: bpm, breath per minute; BR, breathing rate.
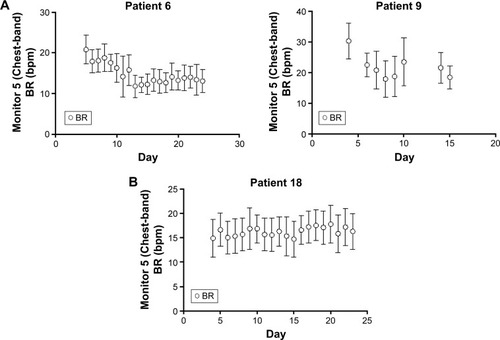
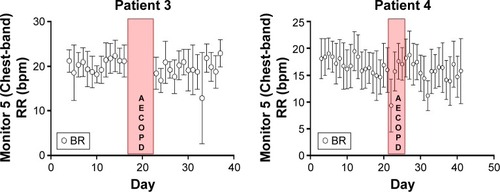
Figure 5 Monitored patients 3 and 4 during two cycles of AECOPD.
Abbreviations: bpm, breath per minute; BR, breathing rate; AECOPD, exacerbations of chronic obstructive pulmonary disease; RR, respiratory rate.