Figures & data
Figure 1 Experimental setup.
Abbreviations: BiPAP, bi-level positive airway pressure; PEV, plateau exhalation valve.
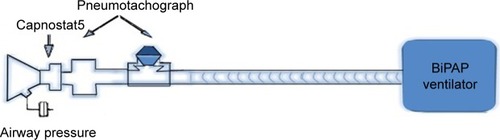
Table 1 Characteristics of study subjects
Table 2 Comparison of breath characteristics at rest and peak exercise in COPD patients
Figure 2 The changes of Ex/Te varied with Vte/Te throughout rest and exercise periods in one representative subject.
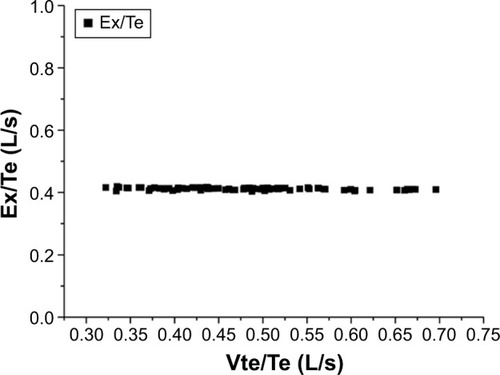
Figure 3 The changes of tidal FiCO2 varied with Vte/Te throughout rest and exercise periods in two representative subjects (A, B).
Notes: (■) Data points are mean values of the expiratory tidal flow and fraction of inspired CO2 of the next breath for respective subjects. (-) represents the curve that fits the scatter plot.
Abbreviations: FiCO2, fractional concentration of inspired CO2; Vte/Te, mean expiratory flow.
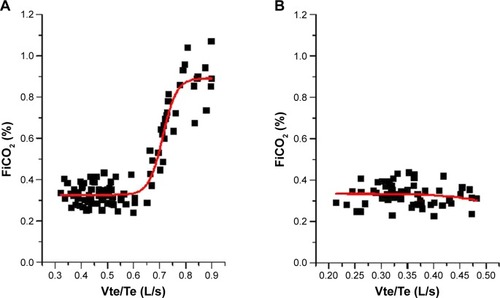
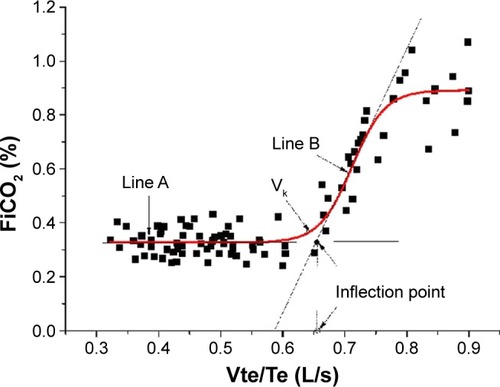
Figure 4 Typical example of analysis of nonlinear curve fitness of mean expiratory flow-tidal FiCO2 curve.()()Notes: The filled square (■) on the fitted curve (thick line) represents Vk which divides the curve to yield the best fit of two lines (A and B, thin lines). Closed circle (○) represents the calculated inflection point.