Figures & data
Table 1 Baseline characteristics for total population and for each group of the primary outcome with non-adjusted hazard ratio
Figure 1 Kaplan–Meier curve of survival without death or new readmission (primary outcome) in patients with an exacerbation of COPD.
Note: 95%CI is in dashed lines.
Abbreviation: CI, confidence interval.
Abbreviation: CI, confidence interval.
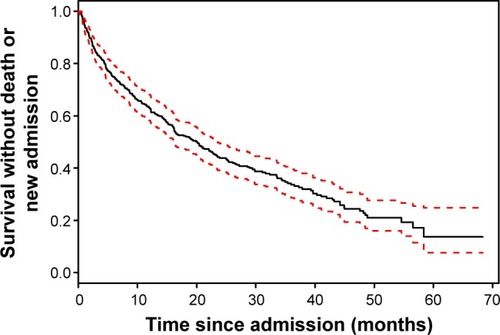
Table 2 Multivariate analysis for the primary outcome (death or readmission)
Table 3 Multivariate analysis for the primary outcome with predictive miss-matching data imputation
Table 4 Baseline characteristics for total population and for each group of the secondary outcome (death) with nonadjusted and adjusted hazard ratio
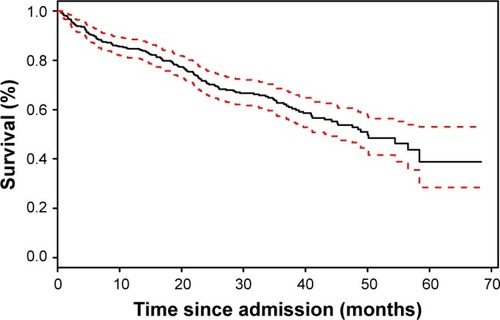
Figure 2 Kaplan–Meier curve of survival for COPD patients after acute exacerbation after 1 year.
Note: 95%CI is in dashed lines.
Abbreviation: CI, confidence interval.
Abbreviation: CI, confidence interval.