Figures & data
Table 1 Baseline patient characteristics
Table 2 Results of baseline lung volume measurement
Figure 1 Correlation between the RV/TLC ratio and the percentage of predicted value of post-bronchodilator FEV1 at baseline measurement.
Abbreviations: RV, residual volume; TLC, total lung capacity; FEV1, forced expiratory volume in 1 second.
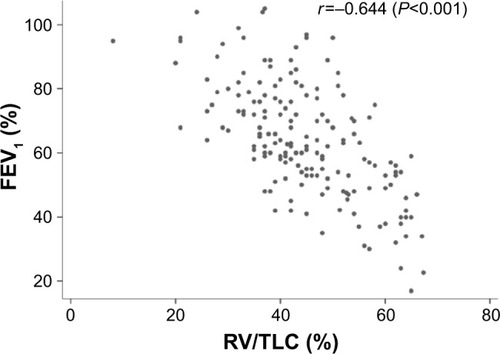
Figure 2 Distribution of estimated annual rate of change in the RV/TLC ratio.
Abbreviations: RV, residual volume; TLC, total lung capacity.
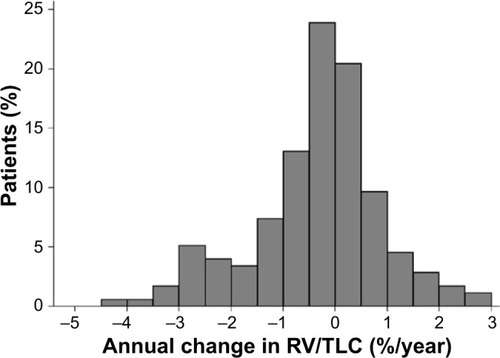
Figure 3 Distribution of estimated annual rate of change in the IC/TLC ratio.
Abbreviations: IC, inspiratory capacity; TLC, total lung capacity.
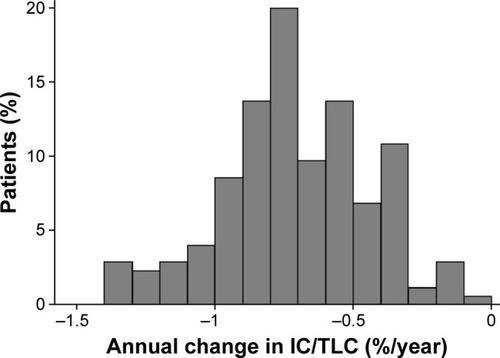
Table 3 Effect of exacerbation and treatment on the change in RV/TLC ratio and IC/TLC ratio
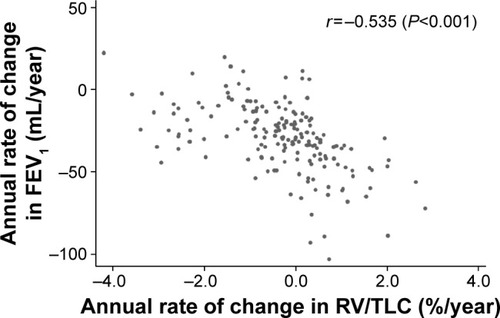
Figure 4 The negative correlation between the rates of change in FEV1 and RV/TLC ratio.
Abbreviations: FEV1, forced expiratory volume in 1 second; RV, residual volume; TLC, total lung capacity.