Figures & data
Table 1 Proportion of subjects below and above the cutoff of 105 CFU/mL that had a negative or positive microbiology results at stable state
Table 2 Baseline characteristics of the 142 COPD subjects included in this analysis of pentraxin 3 levels
Figure 1 Correlations between PTX3 and (A) TCC in sputum; (B) absolute neutrophil count in sputum; (C) CFU/mL (C); and (D) bacterial load measured by 16S quantitative polymerase chain reaction.
Abbreviations: CFU, colony forming units; PTX3, pentraxin 3; TCC, total cell count.
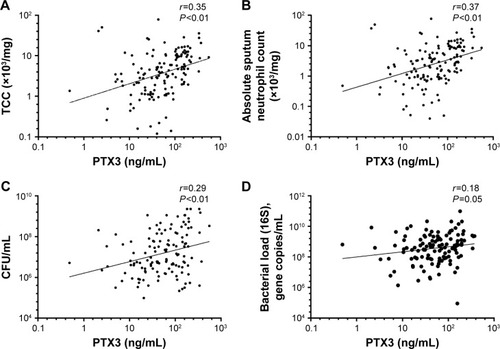
Figure 2 PTX3 levels from 10 subjects over three stable visits.
Abbreviations: CI, confidence interval; PTX3, pentraxin 3.
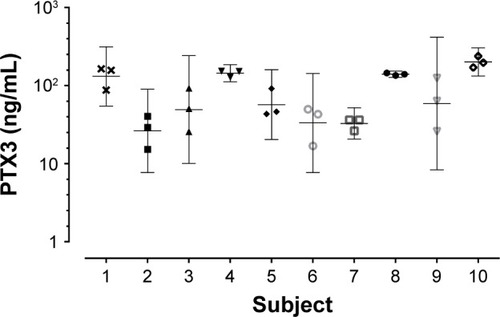
Table 3 Difference in culture growth between subjects that saw an increase in PTX3 levels compared with those that saw a decrease from stable to exacerbation state
Figure 3 PTX3 levels when divided according to the presence of a virus or bacterial infection.
Note: Mean 95% CI.
Abbreviations: CI, confidence interval; PTX3, pentraxin 3.
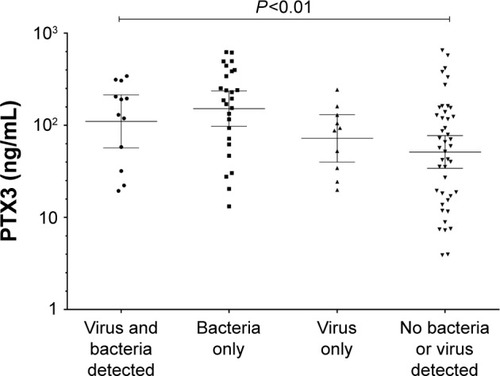
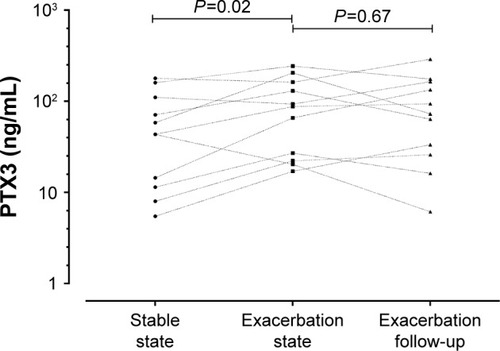
Figure 4 PTX3 levels in 11 paired sputum samples at stable, exacerbation, and 2 weeks post-exacerbation treatment.