Figures & data
Figure 1 Body composition analysis and differences in fat distribution.
Abbreviations: CT, computed tomography; BMI, body mass index; SCAT, subcutaneous adipose tissue; VAT, visceral adipose tissue; MT, muscle tissue; CSA, cross-sectional area; HU, Hounsfield unit; AT, adipose tissue.
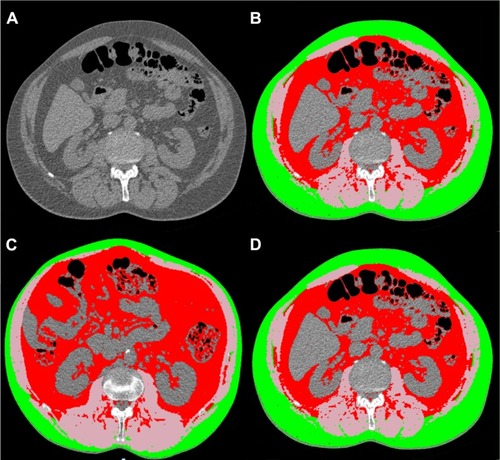
Table 1 Baseline characteristics by group
Table 2 Internal validity and external validity of the CT image analysis
Figure 2 Group mean values ± SD for BMI (A), CSA of VAT (B), MT attenuation (C), CSA of MT (D) and CSA of SCAT (E) in patients with COPD (gray bars) and in controls (black bars).
Abbreviations: BMI, body mass index; CSA, cross-sectional area; VAT, visceral adipose tissue; MT, muscle tissue; SCAT, subcutaneous adipose tissue; GOLD, Global Initiative for Chronic Obstructive Lung Disease; HU, Hounsfield unit; SD, standard deviation.
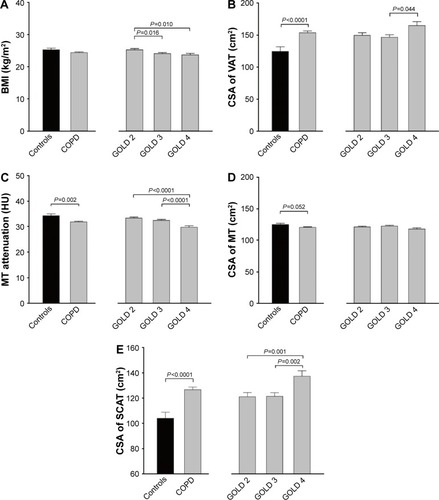
Figure 3 Trend analysis between CT body composition parameters and clinical outcomes in COPD.
Notes: Trend analysis between CSA of VAT (A), MT attenuation (B), and CSA of MT (C), and the 6MWD, exacerbation rate, SGRQ and FEV1 decline. For each body composition parameter, the panels report the odds ratio (mean and 95% CI) of having a worse clinical outcome with the deterioration of the body composition parameter from quartile 1 (reference) to quartiles 2, 3 and 4. The P-values indicate the statistical significance for the trend of the association.
Abbreviations: CT, computed tomography; CSA, cross-sectional area; VAT, visceral adipose tissue; MT, muscle tissue; 6MWD, 6-minute walking distance; SGRQ, St George’s Respiratory Questionnaire; FEV1, forced expiratory volume in 1 second; CI, confidence interval.
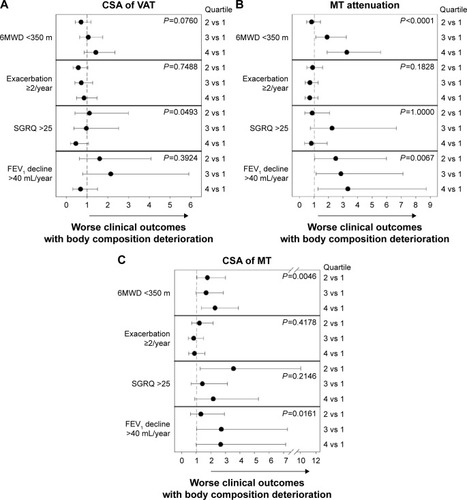
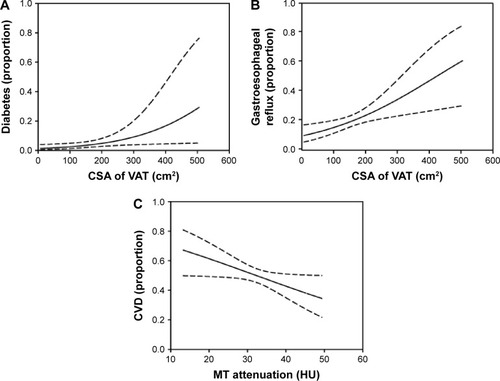
Figure 4 Logistic regression models indicating significant correlations between CT body composition parameters and the proportion of comorbidities for diabetes (A), gastroesophageal reflux (B), and CVD (C) at baseline.
Abbreviations: CT, computed tomography; CI, confidence interval; VAT, visceral adipose tissue; CSA, cross-sectional area; CVD, cardiovascular disease; MT, muscle tissue; HU, Hounsfield unit.