Figures & data
Table 1 Demographic details of trial participants
Table 2 Symptom length in exacerbations shown as median and interquartile range for both treated and untreated episodes
Figure 1 Length of untreated and treated exacerbations is shown as a box and whisker plot.
Notes: The bold horizontal line is the median value. The box is the interquartile range and the bars represent the 95% confidence interval with outliers shown as open circles and extreme outliers shown with asterisks.
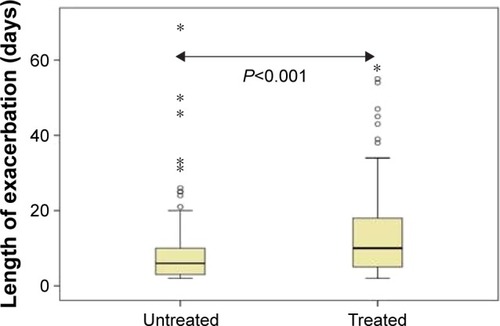
Figure 2 Exacerbation treatment by Anthonisen type and symptom predominance.
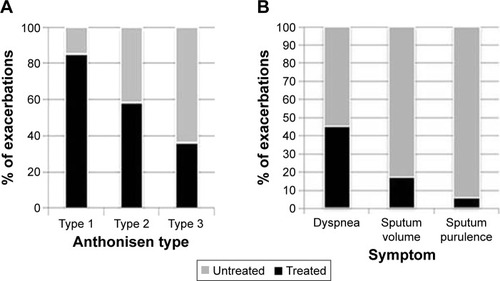
Table 3 Variables in the equation for logistic regression of all exacerbations
Table 4 Logistic regression of exacerbations in patients with chronic bronchitis
Table 5 Logistic regression of exacerbation episodes in patient without chronic bronchitis
Figure 3 Patterns of exacerbations.
Abbreviation: SOB, dyspnea score.
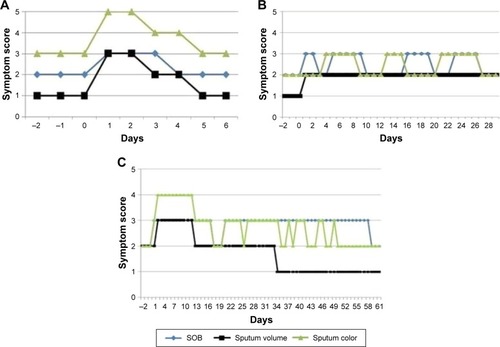
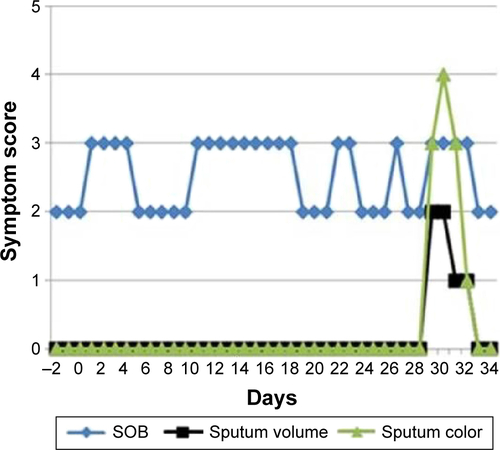
Figure S1 Exacerbation in which only one symptom (dyspnea) oscillates for >3 weeks before all other major Anthonisen symptoms deteriorate.
Notes: Dyspnea was scored on a 4-point scale (2= normal or usual for me, 3= worse than usual, 4= much worse than usual, and 1= better than usual), daily sputum volume was scored as none =(0), 1= (up to a teaspoonful), 2= (up to a tablespoonful), 3= (up to an egg-cupful), 4= (more than an egg-cupful), and sputum color was assessed using the Bronkotest color chart (1–2 being mucoid and 3, 4, and 5 being increasing purulence).
Abbreviation: SOB, dyspnea score.