
Figures & data
Table 1 Comparison of individual parameters between subjects with and without AL
Figure 1 s-UA levels in subjects with and without airflow limitation.
Notes: Former and current smokers without AL had higher s-UA levels compared to never-smokers without AL. Additionally, subjects with AL also had higher s-UA levels than never-smokers without AL.
Abbreviations: s-UA, serum uric acid; AL, airflow limitation.
Abbreviations: s-UA, serum uric acid; AL, airflow limitation.
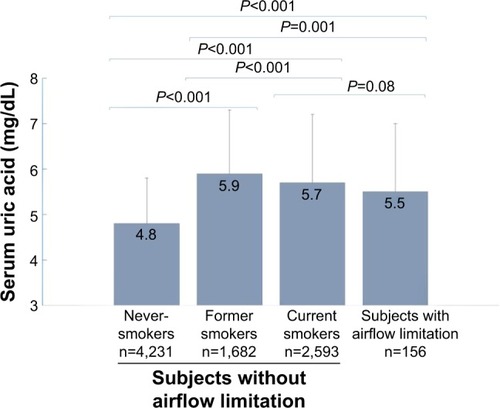
Table 2 Correlation analysis between FEV1 %predicted and parameters measured at medical health check-ups
Figure 2 Relationship between FEV1 %predicted and s-UA.
Note: A weak but significant correlation was observed between FEV1 %predicted and s-UA.
Abbreviations: FEV1, forced expiratory volume in 1 second; s-UA, serum uric acid.
Abbreviations: FEV1, forced expiratory volume in 1 second; s-UA, serum uric acid.
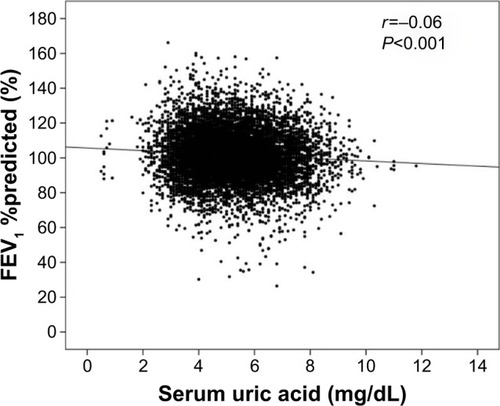
Table 3 Multiple logistic regression analysis (association with AL)