
Figures & data
Table 1 Demographics, characteristics, and costs among patients with index hospitalization for COPD exacerbation between 2010 and 2014
Table 2 Costs by hospital discharge location after index hospitalization for COPD between 2010 and 2014
Table 3 Characteristics by ALC status during index hospitalization for COPD exacerbation in the top cost quintile (Q5, n=379 patients), 2010–2014
Figure 1 Relative contribution of hospital days spent under ALC status, acute care, and in ICU, to the mean total length of stay in hospital among middle (Q2–Q4) and top (Q5) cost quintiles.
Abbreviations: ALC, alternate level of care; ICU, intensive care unit.
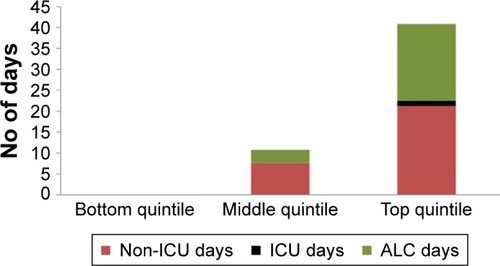
Table 4 Adjusted odds ratios for factors contributing to high-cost hospitalizations (Q5) for patients hospitalized with COPD between 2010 and 2014