
Figures & data
Figure 1 Flow diagram showing the selection process of material from identification to inclusion.
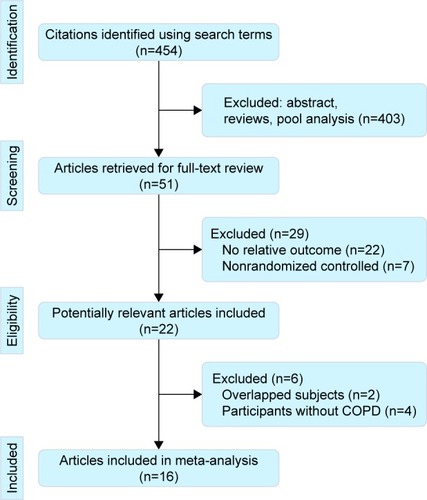
Table 1 Characteristics of included studies
Figure 2 The effect of PIC window on mortality during hospital admission.
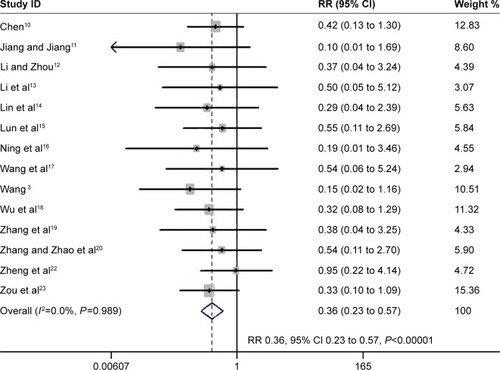
Figure 3 The effect of PIC window on VAP.
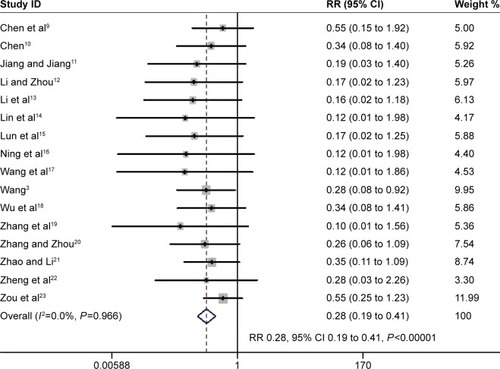
Figure 4 The effect of PIC window on duration of MV.
Abbreviations: PIC, pulmonary infection control; MV, mechanical ventilation; WMD, weighted mean difference; CI, confidence interval; IMV, intermittent mandatory ventilation.
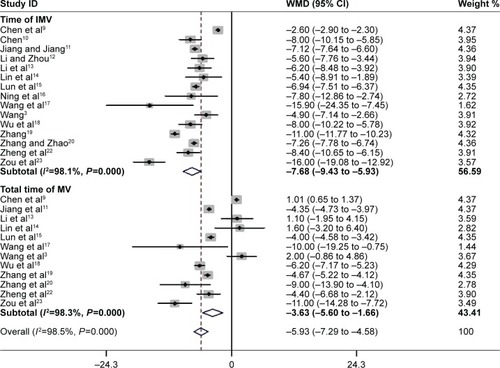
Figure 5 The effect of PIC window on length of ICU stay and hospital stay.
Abbreviations: PIC, pulmonary infection control; ICU, intensive care unit; WMD, weighted mean difference; CI, confidence interval; ICU, intensive care unit.
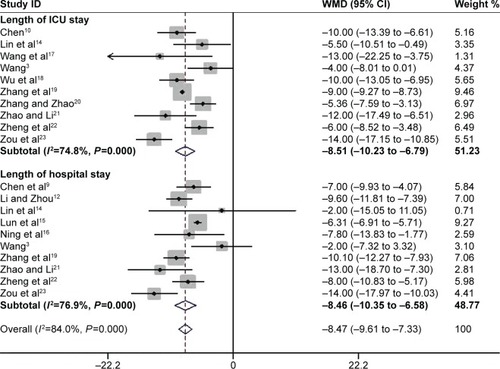
Figure 6 The effect of PIC window on adverse events associated with weaning.
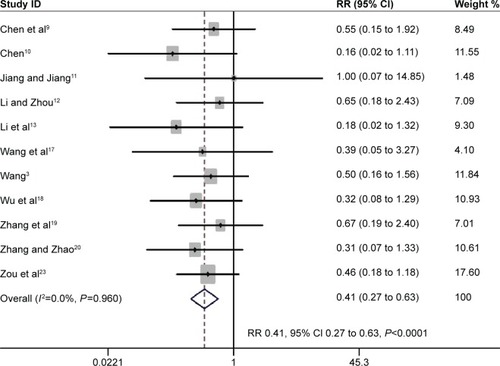
Figure S1 Risk of bias analysis.
Notes: (A) Risk-of-bias summary: the authors’ judgments about each risk-of-bias item for the each included studies. (B) Risk-of-bias graph: the authors’ judgments about each risk-of-bias item presented as percentages across all included studies.
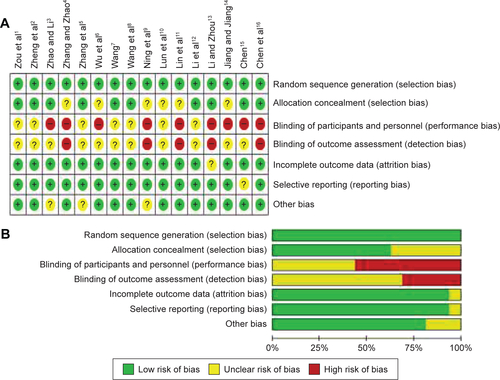
Figure S2 Sensitivity analysis.
Notes: (A) Time of IMV. (B) Total time of MV. (C) Length of ICU stay. (D) Length of hospital stay.
Abbreviations: IMV, intermittent mandatory ventilation; MV, mandatory ventilation; ICU, intensive care unit; CI, confidence interval.
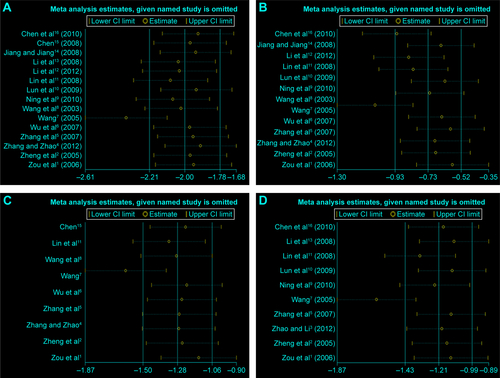
Figure S3 Publication bias.
Notes: The primary outcomes mortality (A and B) and ventilator-associated pneumonia (C and D) were detected by Begg’s and Egger’s tests.
Abbreviations: SE, standard error; OR, odds ratio.
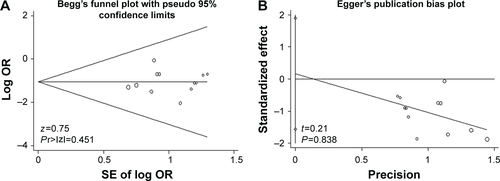
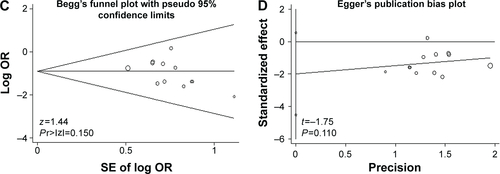
Table S1 Results of subgroup analyses from a meta-analyses of randomized controlled trials