
Figures & data
Figure 1 Scatter plot of leak recorded in built-in software.
Abbreviations: MV, minute volume; Vt, tidal volume; BPM, breath per minuter; IT, inspiratory time.
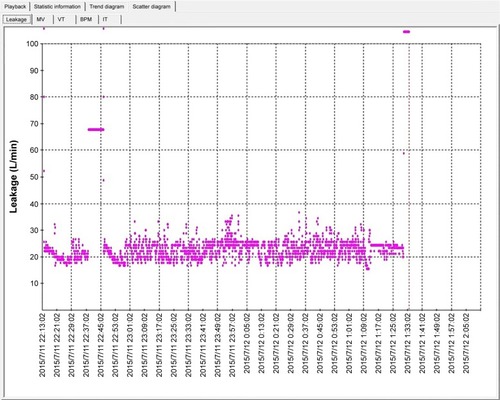
Figure 2 Parameters recorded in built-in software.
Abbreviations: MV, minute volume; Vt, tidal volume; BPM, breath per minuter; IT, inspiratory time.
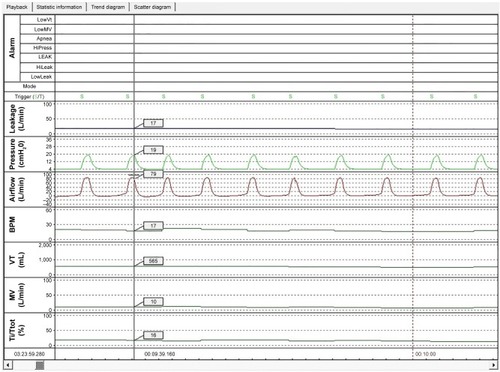
Table 1 Baseline demographic and clinical characteristics of patients
Figure 3 CONSORT flow diagram.
Abbreviations: CONSORT, consolidated standards of reporting trials; LTOT, long-term oxygen therapy; NPPV, noninvasive positive pressure ventilation.
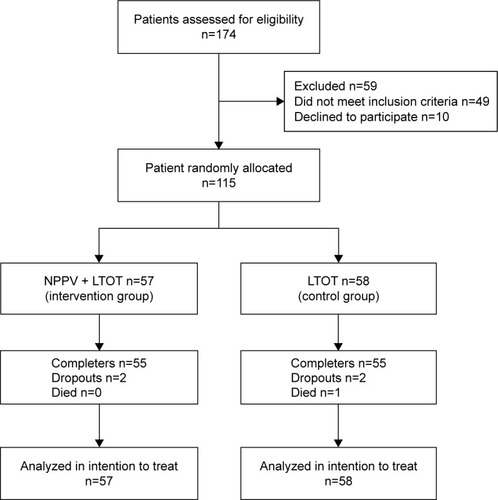
Figure 4 Bland-Altman plots for absolute reliability of parameters estimation between the Flexo and LabChart.
Notes: (A) Bland–Altman plots for absolute reliability (means vs differences) of leak estimation between the Flexo and LabChart. (B) Bland–Altman plots for absolute reliability (means vs differences) of pressure estimation between the Flexo and LabChart.
Abbreviation: SD, standard deviation.
Abbreviation: SD, standard deviation.
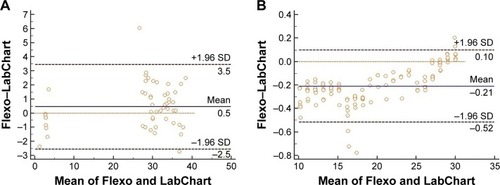
Table 2 6MWD
Table 3 Treatment period effect between two groups