Figures & data
Figure 1 Referrals to the ACERS team.
Notes: Number and reasons for referral to the ACERS team for each quarter (Q1–Q4) of financial years 2011/12–2014/15 (financial years run from April to the following March, so 2011/12 indicates April 2011 to March 2012). The total number of patients seen by the ACERS team from 2011/12 to 2014/15 is nearly 6,000. The number of referrals to the ACERS team has increased over time from 450 in 2011/12 to 2,000 per year in 2014/15. Data were collected from hospital electronic records and RiO. Large numbers of “not recorded” for Q3 and Q4 for 2014/15 are due to a decrease in recording linked with changes to the RiO system (making “reason for referral” a non-mandatory field).
Abbreviation: ACERS, Acute COPD Early Response Service.
Abbreviation: ACERS, Acute COPD Early Response Service.
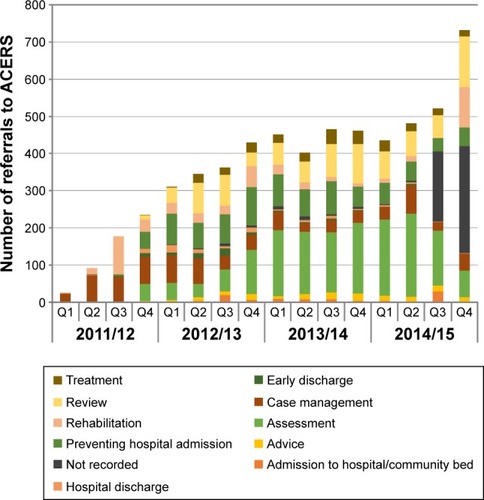
Table 1 COPD QOF indicators for City and Hackney, London and England
Table 2 Admissions and time spent in hospital for admissions for COPD
Figure 2 Rate of admissions to hospital for COPD.
Notes: The number of admissions to hospital (any trust) for London CCG areas (ONS group London Cosmopolitan) for COPD (primary reason for admission) per 1,000 population (ONS resident population data) over time. Admissions have decreased in City and Hackney between 2007 and 2014. Financial years run from April to the following March, so 2007/08 indicates April 2007 to March 2008, etc. Admissions data from HES. Information on HES data available at: http://content.digital.nhs.uk/hes. Accessed April 15, 2015. Copyright © 2015, Re-used with the permission of the Health and Social Care Information Centre, also known as NHS Digital. All rights reserved.Citation17
Abbreviations: CCG, Clinical Commissioning Group; ONS, Office for National Statistics; HES, Hospital Episode Statistics.
Abbreviations: CCG, Clinical Commissioning Group; ONS, Office for National Statistics; HES, Hospital Episode Statistics.
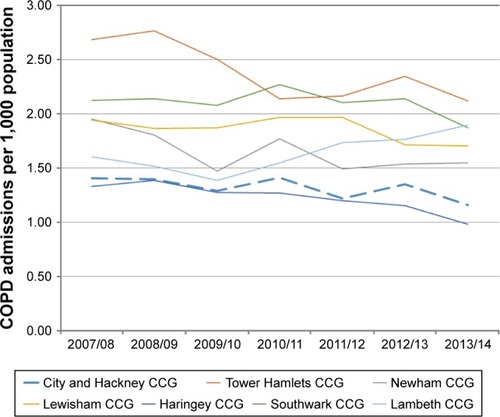
Figure 3 LOS in hospital for COPD admissions.
Notes: HES data on length of inpatient hospital stay for COPD admissions to Homerton Hospital (by City and Hackney residents only). For each period, percentage of all admissions that were short stay (0–1 day), medium stay (2–5 days) or long stay (6 or more days) are shown. Line shows the percentage of all episodes with an LOS that was 0 days or 1 day. This proportion increases over time with the introduction of the ACERS team. Financial years run from April to the following March, so 2007/08 indicates April 2007 to March 2008, etc. Data from HES. Information on HES data available at: http://content.digital.nhs.uk/hes. Accessed April 15, 2015. Copyright © 2015, Re-used with the permission of the Health and Social Care Information Centre, also known as NHS Digital. All rights reserved.Citation17
Abbreviations: LOS, length of stay; HES, Hospital Episode Statistics; ACERS, Acute COPD Early Response Service.
Abbreviations: LOS, length of stay; HES, Hospital Episode Statistics; ACERS, Acute COPD Early Response Service.
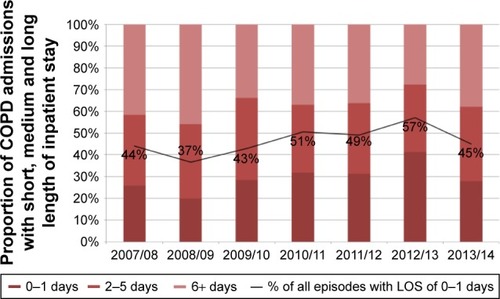
Figure 4 Hospital bed days for COPD admissions.
Notes: Total bed days spent by City and Hackney residents due to COPD admissions at the Homerton Hospital. Total bed days and number of admissions are shown for each period, along with average LOS per patient (calculated from number of bed days per admission). The total bed days have decreased between 2007 and 2014. Financial years run from April to the following March, so 2007/08 indicates April 2007 to March 2008, etc. Data from HES. Information on HES data available at: http://content.digital.nhs.uk/hes. Accessed April 15, 2015. Copyright © 2015, Reused with the permission of the Health and Social Care Information Centre, also known as NHS Digital. All rights reserved.Citation17
Abbreviations: HES, Hospital Episode Statistics; LOS, length of stay.
Abbreviations: HES, Hospital Episode Statistics; LOS, length of stay.
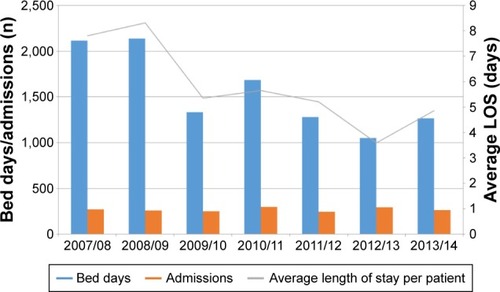
Table 3 Percentage of deaths in hospital and out of hospital (deaths from COPD only) following the introduction of the ACERS team
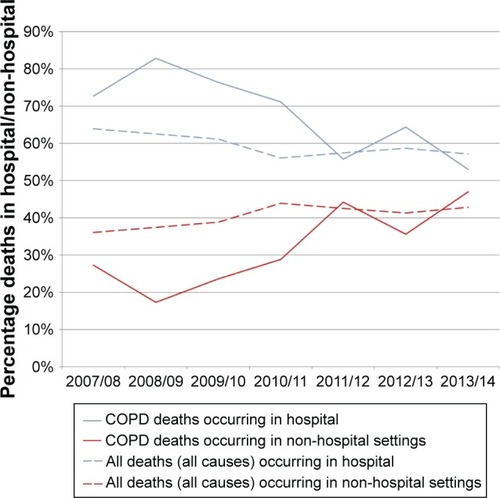
Figure 5 Place of death for deaths from COPD and all deaths.
Notes: ONS data on place of deaths for City and Hackney residents for all causes of death and deaths from COPD alone. Graph shows the proportion of deaths in hospital and out of hospital (covering home, hospice and others). The proportion of deaths occurring in hospital has decreased over time for all causes of death, but the proportion of deaths from COPD that occur in hospital has decreased at a faster rate. Financial years run from April to the following March, so 2007/08 indicates April 2007 to March 2008, etc.
Abbreviation: ONS, Office for National Statistics.
Abbreviation: ONS, Office for National Statistics.