Figures & data
Table 1 Primers information for PCR used in this study
Figure 1 Differentially expressed miRNAs among group C (non-smoker non-COPD), group S (smoker without COPD), group S-COPD (smoker with stable COPD) and group AE-COPD (smoker with acute exacerbation COPD). (A) MicroRNAs microarray representing the expression levels of 56 miRNAs were changed between the four groups (n=3 in each group). (B) qPCR validation of six miRNAs in blood samples (fold changes, n=10, *P<0.05, **P<0.01, ***P<0.001).
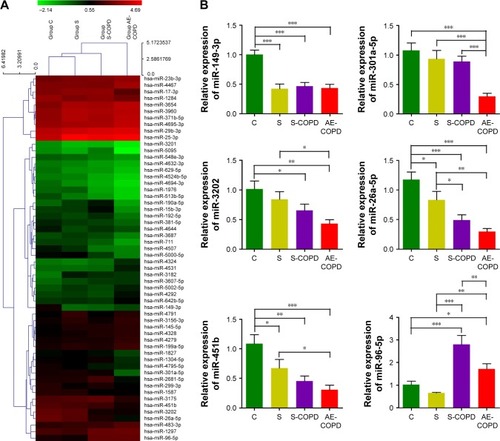
Figure 2 CSE induced down-regulation of miR-149-3p and up-regulation of TLR-4 in THP-1 cells.
Notes: (A) ELISA results showed that concentration of IL-1β and TNF-α significantly increased in CSE group compared with the NC group (n=3, *P<0.05). (B and C) The wild-type TLR-4 3′-UTR or mutant TLR-4 3′-UTR containing vector was co-transfected into THP-1 cells with miR-149-3p mimics. The luciferase activity was measured using the luciferase reporter gene assay (*P<0.05). (D and E) qPCR detected the expression levels of miR-149-3p and TLR-4 (*P<0.05). (F) Western blot analysis of TLR-4 and NF-κB p65 proteins in THP-1 cells.
Abbreviations: CSE, cigarette smoke extract; ELISA, enzyme-linked immunosorbent assay; IL, interleukin; NC, negative control; NF-κB, nuclear factor κB; qPCR, quantitative polymerase chain reaction; TLR-4, Toll-like receptor-4; TNF, tumor necrosis factor; UTR, untranslated region.
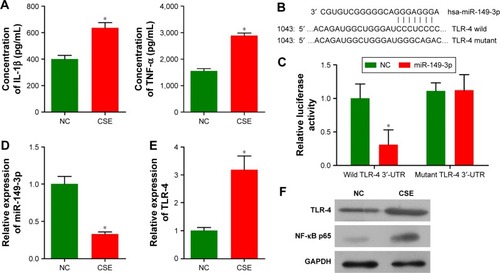
Figure 3 The protein expression level of TLR-4 (A) and NF-κB p65 (B) was detected by the immunofluorescence assay in THP-1 cells.
Abbreviations: CSE, cigarette smoke extract; DAPI, 4′,6-diamidino-2-phenylindole; NC, negative control; NF-κB, nuclear factor κB; TLR-4, Toll-like receptor-4.
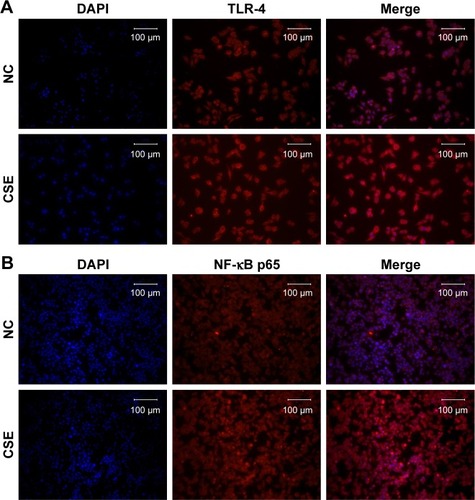
Figure 4 Inhibition of miR-149-3p activated the TLR-4/NF-κB p65 signaling pathway.
Notes: (A) ELISA showed that concentration of IL-1β and TNF-α significantly increased in THP-1 cells transfected with NC or miR-149-3p inhibitors (n=3, *P<0.05). (B and C) qPCR and Western blot detected the expression level of TLR-4 and NF-κB p65 (*P<0.05).
Abbreviations: ELISA, enzyme-linked immunosorbent assay; IL, interleukin; miR, microRNA; NC, negative control; NF-κB, nuclear factor κB; qPCR, quantitative polymerase chain reaction; TLR-4, Toll-like receptor-4; TNF, tumor necrosis factor.
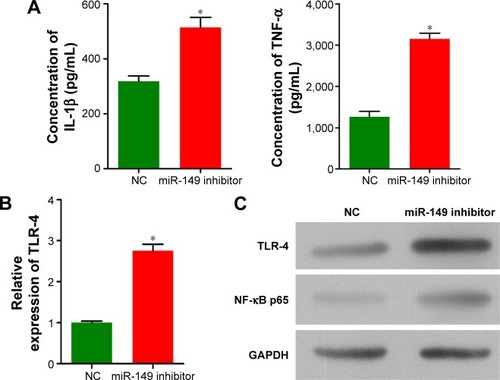
Figure 5 The protein expression level of TLR-4 (A) and NF-κB p65 (B) in THP-1 cells transfected with NC or miR-149-3p inhibitors was detected by the immunofluorescence assay.
Abbreviations: DAPI, 4′,6-diamidino-2-phenylindole; NC, negative control; NF-κB, nuclear factor κB; TLR-4, Toll-like receptor-4.
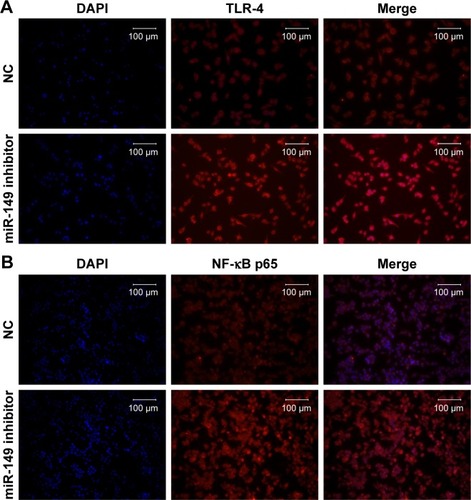
Figure 6 miR-149-3p overexpression reversed the effect of CSE on THP-1 cells.
Notes: (A) qPCR detected the expression level of miR-149-3p (n=3, ***P<0.001). (B) ELISA showed that concentration of IL-1β and TNF-α significantly decreased in miR-149-3p-overexpressed group compared with control group (only stimulated with CSE) (*P<0.05). (C and D) qPCR and Western blot detected the expression level of TLR-4 and NF-κB p65 (*P<0.05).
Abbreviations: CSE, cigarette smoke extract; ELISA, enzyme-linked immunosorbent assay; IL, interleukin; miR, microRNA; NF-κB, nuclear factor κB; qPCR, quantitative polymerase chain reaction; TLR-4, Toll-like receptor-4; TNF, tumor necrosis factor.
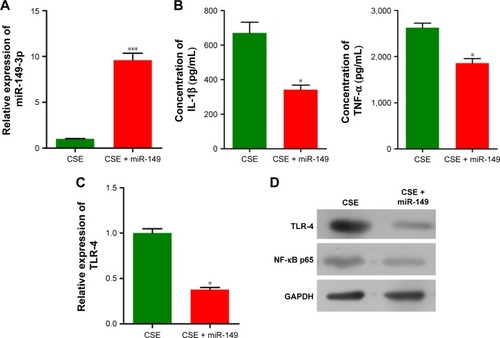
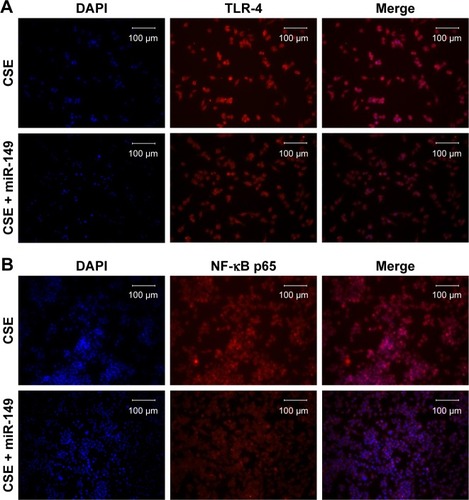
Figure 7 The protein expression level of TLR-4 (A) and NF-κB p65 (B) was detected by the immunofluorescence assay.
Abbreviations: CSE, cigarette smoke extract; DAPI, 4′,6-diamidino-2-phenylindole; NF-κB, nuclear factor κB; TLR-4, Toll-like receptor-4.