
Figures & data
Figure 1 Study design.
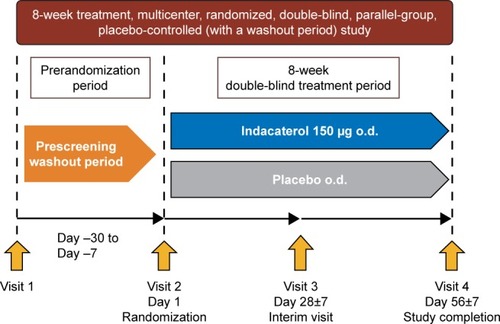
Figure 2 Patient disposition.
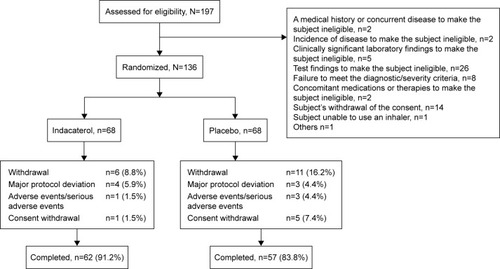
Table 1 Baseline demographic and clinical characteristics
Table 2 Change from baseline in trough FEV1 at week 8 (A) and analysis of change from baseline in FEV1 at week 8 by smoking status and previous use of fixed-dose combination of inhaled β2-agonist and ICS (B)
Figure 3 Change from baseline in trough FEV1 at Week 8 (ITT set and PP set).
Abbreviations: CI, confidence interval; FEV1, forced expiratory volume in 1 s; ITT, intent-to-treat; LS, least squares; PP, per protocol; SE, standard error.
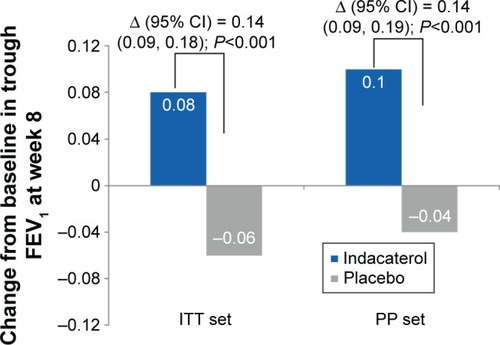
Table 3 Change from baseline in TDI focal scores at Week 8 (A) and change from baseline in SGRQ-C scores at Week 8 (B)
Figure 4 (A) Proportion of patients with a clinically important improvement from baseline in TDI total score (≥1 point; ITT and PP population). (B) Proportion of patients achieving MCID in St George’s Respiratory Questionnaire score.
Abbreviations: ITT, intent-to-treat; MCID, minimal clinically important difference; PP, per protocol; TDI, transition dyspnea index.
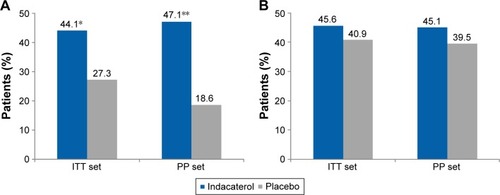
Table 4 Change from baseline in COPD assessment test scores
Table 5 Incidence of frequent adverse events and serious adverse events in treatment groups (safety set)
Table S1 Full list of institutional review boards and ethics committees which approved this study