Figures & data
Table 1 Baseline demographics and clinical characteristics
Table 2 Baseline demographics and clinical characteristics in subsets of patients
Table 3 Summary of baseline exacerbations
Table 4 Summary of baseline exacerbations in subsets of patients
Table 5 Time to initiation of open-triple therapy at 12 months (post-index date)
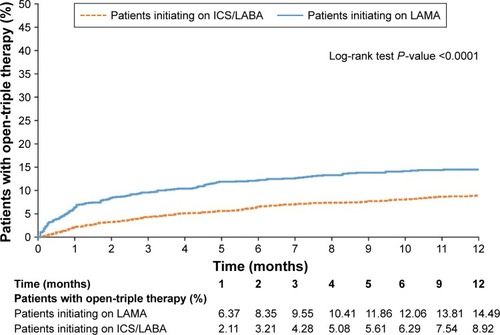
Figure 1 Kaplan–Meier curve to show rates of open-triple therapy initiation at 12 months (post-index date).
Abbreviations: ICS, inhaled corticosteroid; LABA, long-acting β2-agonist; LAMA, long-acting muscarinic antagonist.
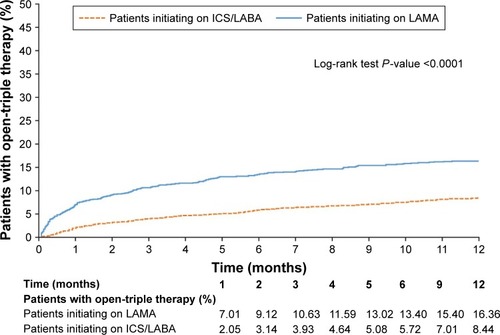
Figure 2 Kaplan–Meier curve to show rates of open-triple therapy initiation at 12 months (post-index date) in patients with pulmonary-function testing information.
Abbreviations: ICS, inhaled corticosteroid; LABA, long-acting β2-agonist; LAMA, long-acting muscarinic antagonist.
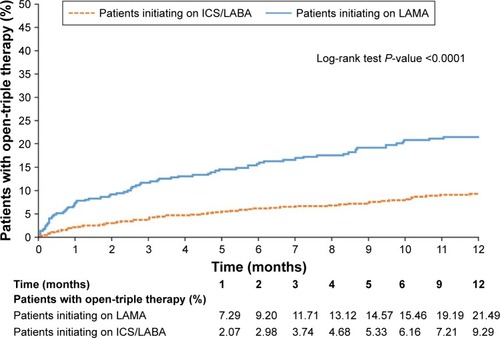
Figure 3 Kaplan–Meier curve to show rates of open-triple therapy initiation at 12 months (post-index date) in patients with asthma.
Abbreviations: ICS, inhaled corticosteroid; LABA, long-acting β2-agonist; LAMA, long-acting muscarinic antagonist.
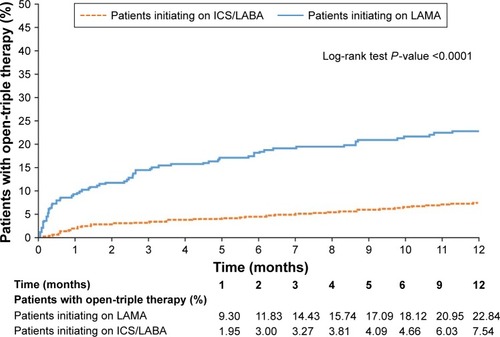
Figure 4 Kaplan–Meier curve to show rates of open-triple therapy initiation at 12 months (post-index date) in patients without asthma.