Figures & data
Figure 1 Study flow diagram.
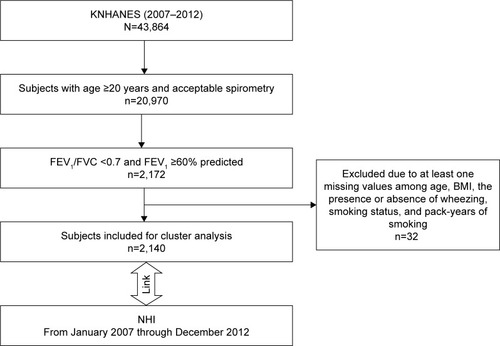
Table 1 Epidemiological characteristics according to subtypes of subjects with mild-to-moderate airflow limitation identified by k-means clustering for k=5 clusters
Figure 2 Distribution of five clusters according to mean FEV1% predicted and amount of smoking.
Abbreviations: COPD, chronic obstructive pulmonary disease; FEV1, forced expiratory volume in 1 second.
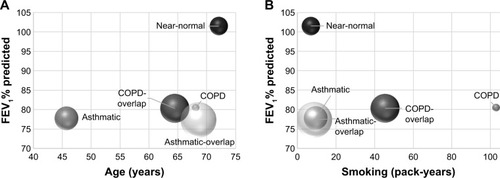
Table 2 Lung function and socioeconomic characteristics according to subtypes of subjects with mild-to-moderate airflow limitation identified by k-means clustering for k=5 clusters
Table 3 Respiratory medication prescribed according to subtypes of subjects with mild-to-moderate airflow limitation
Figure 3 Prescription patterns of respiratory medication.
Abbreviations: COPD, chronic obstructive pulmonary disease; ICS, inhaled corticosteroids; IVCS, intravenous corticosteroids; LABA, long-acting beta-2 agonists; LAMA, long-acting muscarinic antagonists; LTRA, leukotriene receptor antagonist; OCS, oral corticosteroids; SAMA, short-acting muscarinic antagonists; SABA, short-acting beta-2 agonists.
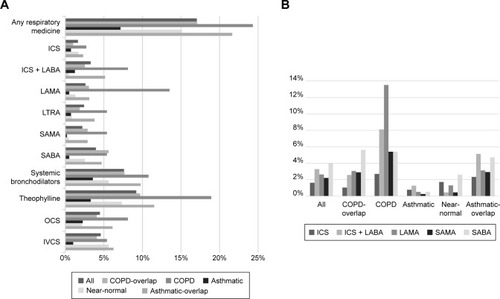
Table 4 Comorbidities according to subtypes of subjects with mild-to-moderate airflow limitation
Table 5 Insurance-related data according to subtypes of subjects with mild-to-moderate airflow limitation
Table 6 Health care utilization according to subtypes of subjects with mild-to-moderate airflow limitation
Figure 4 Proportions of subject number and medical cost of five clusters.
Notes: (A) Proportions of the number in each cluster relative to the total number of subjects. (B) Medical cost of each cluster relative to the total medical cost.
Abbreviation: COPD, chronic obstructive pulmonary disease.
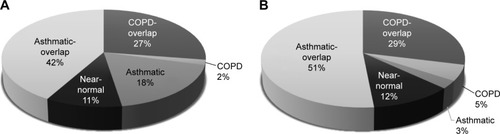
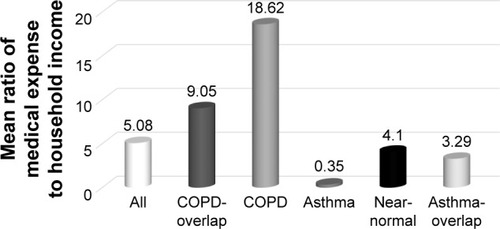
Figure 5 The mean ratio of medical expense to household income according to subtypes of subjects with mild-to-moderate airflow limitation.