
Figures & data
Figure 1 Study protocol.
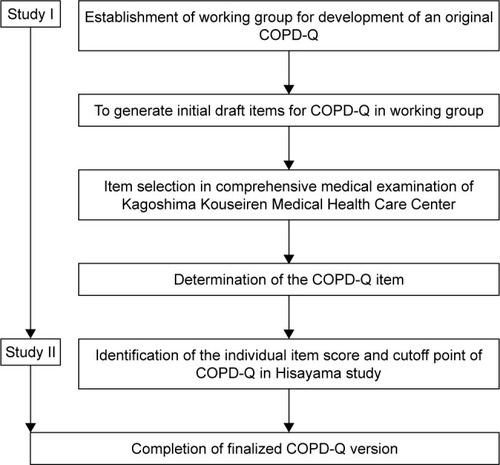
Table 1 Baseline characteristics in study I
Table 2 Results of univariate logistic regression analyses
Table 3 Results of multivariable logistic regression analyses
Table 4 Baseline characteristics in study II
Table 5 Weighted scores based on coefficients in multivariate logistic regression analyses of COPD-Q
Table 6 Various cutoff points for the COPD-Q
Figure 2 A self-scored COPD screening questionnaire.
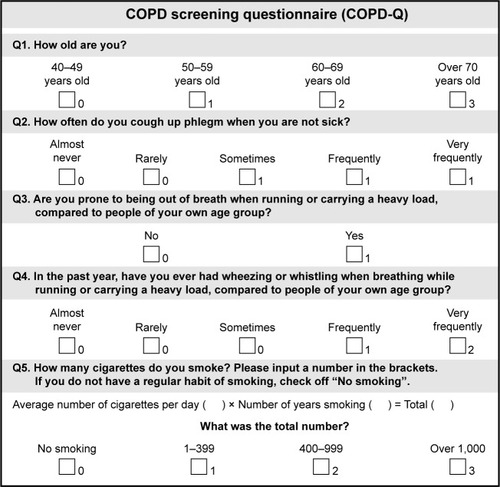
Figure 3 Receiver operating characteristic curve of the COPD-Q for discriminating between subjects with and without AO.
Abbreviations: COPD-Q, COPD screening questionnaire; AO, airflow obstruction.
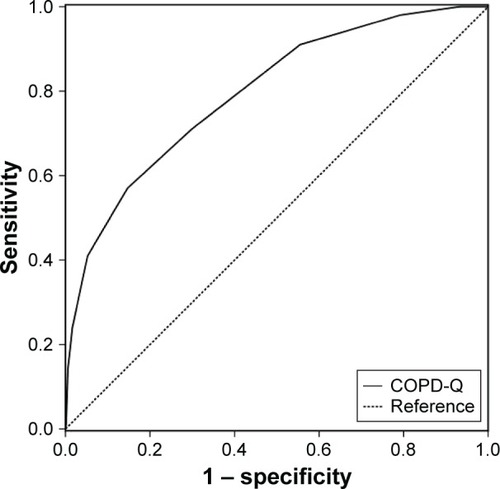
Figure 4 The relationship between COPD-Q score and estimated probability of AO (%). Bars represent the number of AO subjects. Black circles: observed AO (%), curve: estimated AO (%), dotted curves: 95% CI, and horizontal axis: COPD-Q scores.
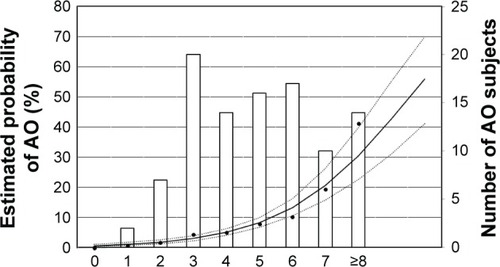
Figure S1 Japanese version of the COPD-Q.
Abbreviation: COPD-Q, COPD screening questionnaire.
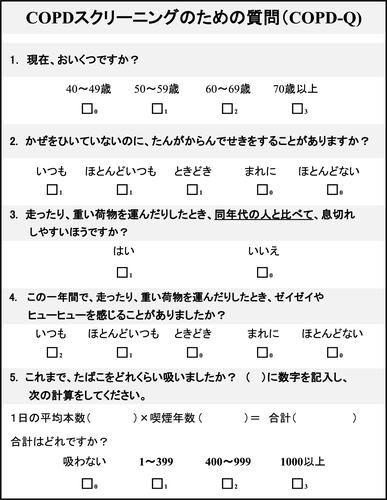
Table S1 The initial draft questionnaire