Figures & data
Figure 1 Four phenotype groups of ACOS.
Abbreviations: ACOS, asthma–COPD overlap syndrome; E, blood eosinophil count; Pyrs, pack years.
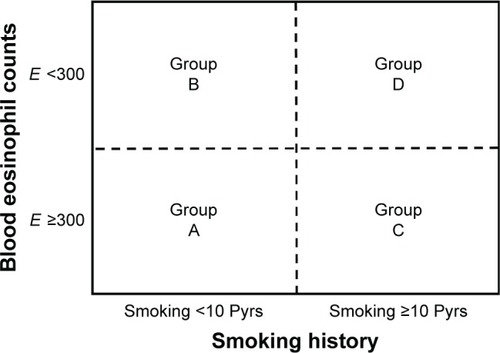
Table 1 Characteristics of the ACOS phenotype groups
Figure 2 Flow diagram for subject enrollment.
Notes: Group A: patients who smoked <10 Pyrs and had blood eosinophil counts ≥300; group B: patients who smoked <10 Pyrs and had blood eosinophil counts <300; group C: patients who smoked ≥10 Pyrs and had blood eosinophil counts ≥300; and group D: patients who smoked ≥10 Pyrs and had blood eosinophil counts <300.
Abbreviations: BDR, bronchodilator response; BHR, bronchial hyperresponsiveness.
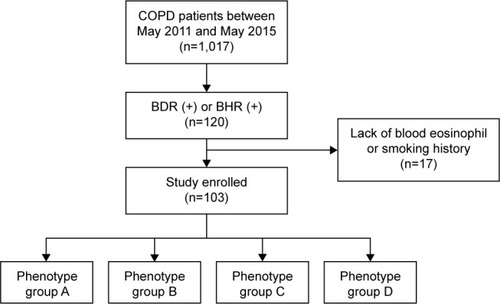
Figure 3 Distribution of patients into four phenotype groups of ACOS.
Notes: The size of the circle represents the number of patients in each group. Group A: patients who smoked <10 Pyrs and had blood eosinophil counts ≥300; group B: patients who smoked <10 Pyrs and had blood eosinophil counts <300; group C: patients who smoked <10 Pyrs and had blood eosinophil counts ≥300; and group D: patients who smoked ≥10 Pyrs and had blood eosinophil counts <300.
Abbreviations: ACOS, asthma–COPD overlap syndrome; E, blood eosinophil count; Pyrs, pack years.
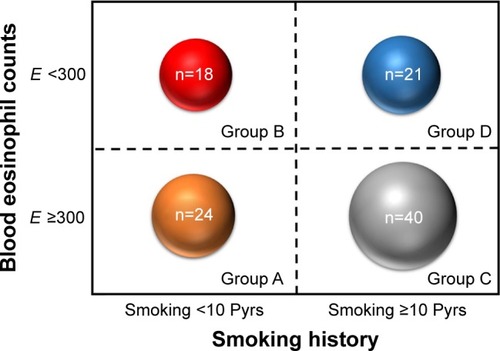
Figure 4 Gender distribution according to four phenotype groups of ACOS.
Abbreviations: ACOS, asthma -COPD overlap syndrome; E, blood eosinophil count; Pyrs, pack years.
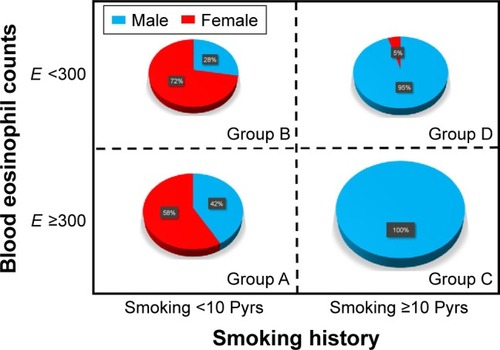
Figure 5 Pattern of medication prescription among four phenotype groups of ACOS.
Abbreviations: ACOS, asthma -COPD overlap syndrome; E, blood eosinophil count; ICS, inhaled corticosteroid; LABA, long-acting beta agonist; LAMA, long-acting muscarinic antagonist; LTRA, leukotriene receptor antagonist; PDE4I, phosphodiesterase 4 inhibitor.
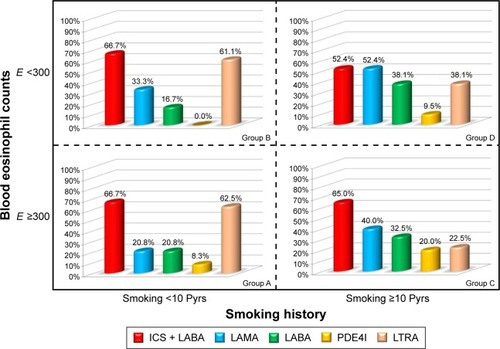
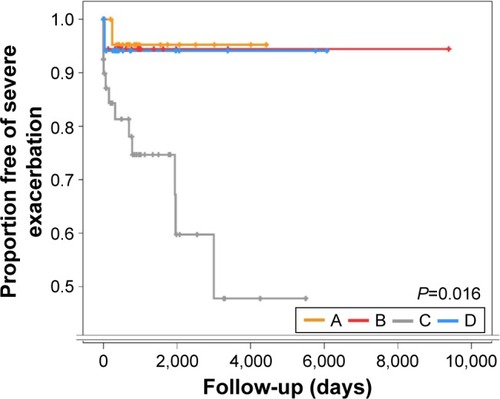
Figure 6 The proportion of patients free of severe exacerbation.