Figures & data
Figure 1 Exercise time (Tex)/Δ oxygen uptake
, that is, time–slope.
Note: The Tex standardized by the increase of
from resting to peak exercise during cardiopulmonary exercise testing.
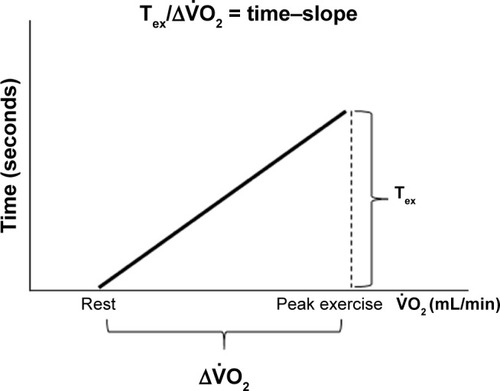
Figure 2 The effects of PR on peak
and Tex.
Abbreviation: PR, pulmonary rehabilitation.
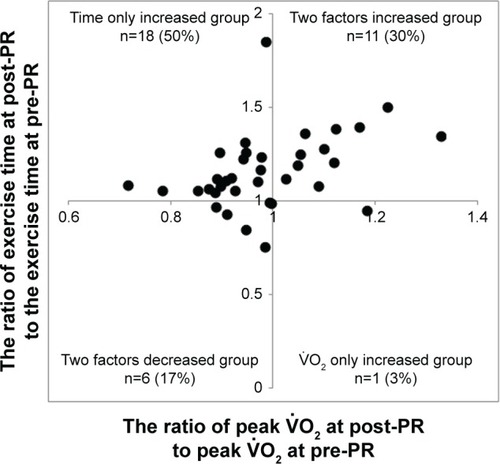
Figure 3 Study flow diagram.
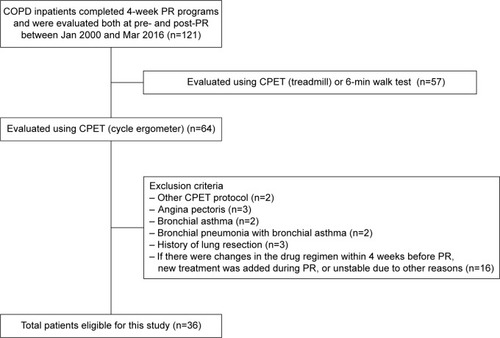
Table 1 Baseline patient characteristics (n=36)
Table 2 Patient characteristics of the two groups before pulmonary rehabilitation
Table 3 Changes in incremental exercise parameters at peak exercise after pulmonary rehabilitation
Table 4 Changes in incremental exercise parameters at iso-time after pulmonary rehabilitation
Figure 4 The changes of exercise variables before and after pulmonary rehabilitation.
Abbreviations: AT, anaerobic threshold; ΔFO2, the inspired oxygen concentration (FiO2) minus expired oxygen concentration (FeO2); peak ex., peak exercise;
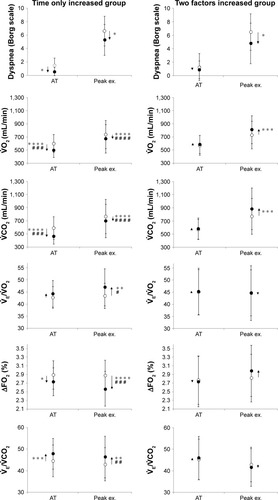
Table 5 Correlations between baseline variables and the change ratio of the time–slope at post-PR to the time–slope at pre-PR (n=36)
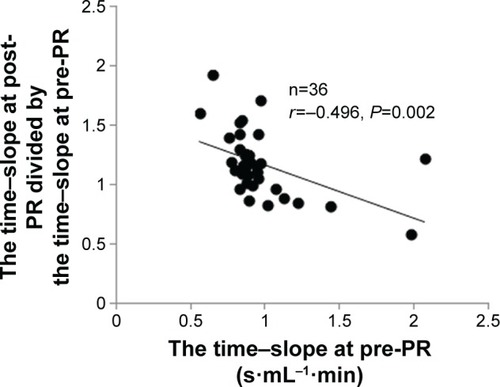
Figure 5 Correlation between the ratio of the post-to-pre-change ratio of the time–slope and the baseline time–slope.