Figures & data
Table 1 Experiment schedule
Figure 1 Morphological changes in endothelial progenitor cells (EPCs) sourced from bone marrow of C57BL/6J mice during culture.
Notes: (A) Representative microscopy of EPCs cultured with endothelial growth medium 2 in the presence of 5% fetal bovine serum on day 1. EPCs formed were spherical, cell sizes were almost the same, and cells were suspended in the culture medium. (B) On day 4 of the culture, the cells were attached to one other, getting larger, and became oval, spindly, or polygonal. (C) On day 7 of the culture, the cells became fusiform or polygonal in pattern. EPCs contacted one another to attempt to form capillary structures (arrows). Magnification ×100.
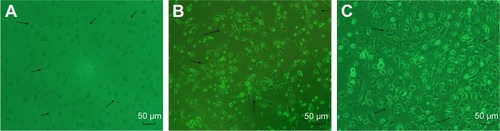
Figure 2 Double-positive cells stained with Dil-acLDL and FITC-UEA1 were identified as endothelial progenitor cells.
Abbreviations: Dil-acLDL, DiI-labeled acetylated low-density lipoprotein; FITC-UEA1, fluorescein isothiocyanate-labeled Ulex europaeus agglutinin 1.
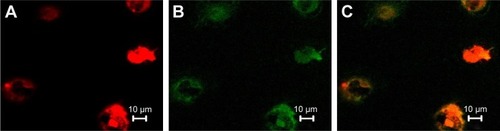
Figure 3 Maximal expiratory flow-volume curves.
Notes: In each image, the peaks (upper) represent the expiratory phase and the troughs (lower) the inspiratory phase. Compared with controls (A), the CSE group (B) and CSE + 5-Aza-CdR group (C) showed abrupt ascents, and descending limbs showed a prolonged expiratory phase.
Abbreviations: CSE, cigarette-smoke extract; 5-Aza-CdR, 5-Aza-2′-deoxycytidine; sec, second; div, division.
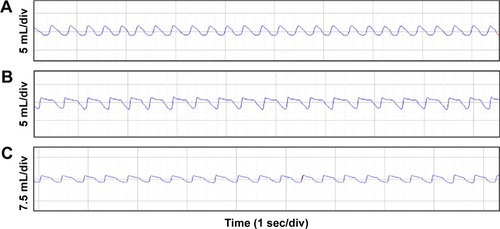
Figure 4 Lung function.
Abbreviations: Cdyn, lung dynamic compliance; CSE, cigarette-smoke extract; 5-Aza-CdR, 5-Aza-2′-deoxycytidine; Raw, airway resistance; PEF, peak expiratory flow; sec, second; Ti, inspiratory time; Te, expiratory time.
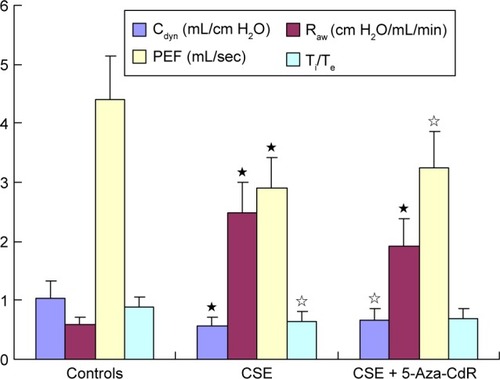
Figure 5 Histomorphological changes in lung tissue.
Notes: Lung tissue in the CSE group (B) exhibited enlarged alveolar space, thinner alveolar septum, and destroyed alveolar wall when compared with controls (A). Lung tissue in the CSE + 5-Aza-CdR group (C) also exhibited enlarged alveolar space, but smaller than that of the CSE group. Magnification ×100.
Abbreviations: CSE, cigarette-smoke extract; 5-Aza-CdR, 5-Aza-2′-deoxycytidine.
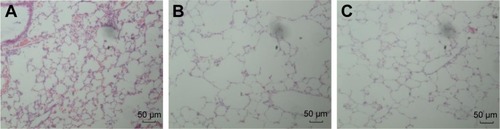
Figure 6 Histomorphological changes in lung tissue.
Abbreviations: CSE, cigarette-smoke extract; 5-Aza-CdR, 5-Aza-2′-deoxycytidine.
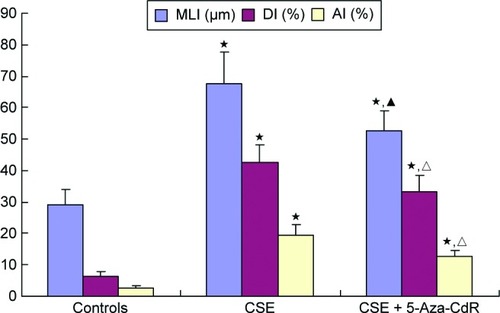
Figure 7 Apoptosis of lung tissue.
Abbreviations: CSE, cigarette-smoke extract; 5-Aza-CdR, 5-Aza-2′-deoxycytidine.
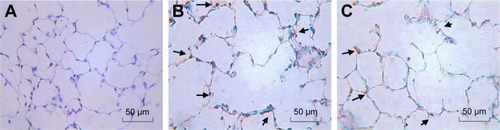
Figure 8 Expression of p16Ink4a protein in lung tissue (A) and EPCs (B). (C) p16Ink4a protein-expression comparison.
Abbreviations: EPCs, endothelial progenitor cells; CSE, cigarette-smoke extract; 5-Aza-CdR, 5-Aza-2′-deoxycytidine; C + A, CSE + 5-Aza-CdR; N, normal (controls).
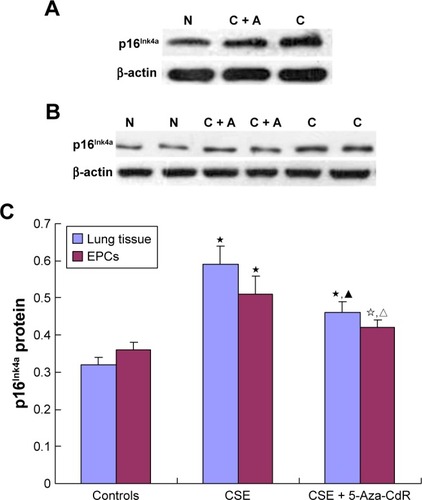
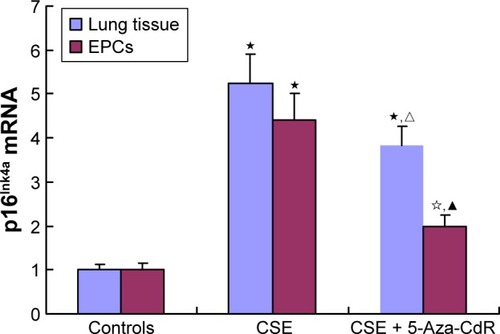
Figure 9 Expression of p16Ink4a mRNA.
Abbreviations: CSE, cigarette-smoke extract; 5-Aza-CdR, 5-Aza-2′-deoxycytidine; EPCs, endothelial progenitor cells.