Figures & data
Table 1 Characteristics of the patients
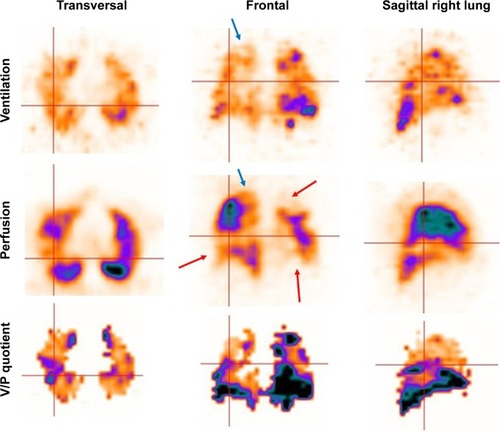
Figure 1 V/P SPECT of a patient with a severe COPD (GOLD 3).
Notes: On the frontal slice, uneven distribution of ventilation and absent ventilation are seen, as is perfusion in the upper lobe (blue arrows indicating emphysema). Hot spots represent changes in small airway disease (dotted blue arrow on sagittal slice).
Abbreviations: GOLD, Global Initiative for Chronic Obstructive Lung Disease; V/P SPECT, ventilation/perfusion single-photon emission computed tomography.
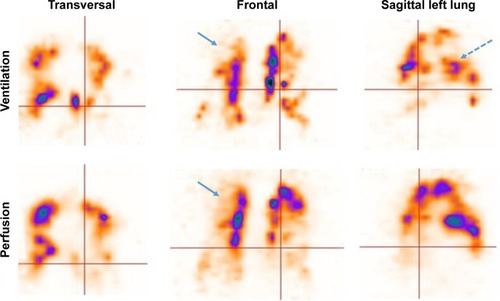
Figure 2 Correlation between Vgrade and TPLF% and GOLD stages.
Note: Pearson correlation coefficients and linear regression lines with best-fit values (continuous line) and 95% confidence intervals (dotted lines) are presented.
Abbreviations: GOLD, Global Initiative for Chronic Obstructive Lung Disease; TPLF%, total preserved lung function; SPECT, single-photon emission computed tomography; Vgrade, penetration grade of Technegas in V SPECT.
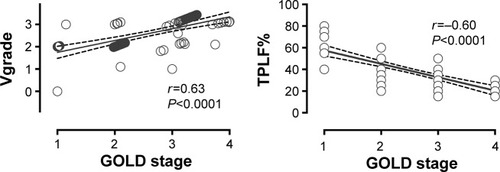
Figure 3 Correlation between Vgrade and TPLF% and results of the technically accepted and reproducible pulmonary lung function tests.
Note: Pearson’s correlation coefficients and linear regression lines with best-fit values (continuous line) and 95% confidence intervals (dotted lines) are presented.
Abbreviations: FEV1, forced expiratory volume in 1 second; FVC, forced vital capacity; TPLF%, total preserved lung function; SPECT, single-photon emission computed tomography; Vgrade, penetration grade of Technegas in V SPECT.
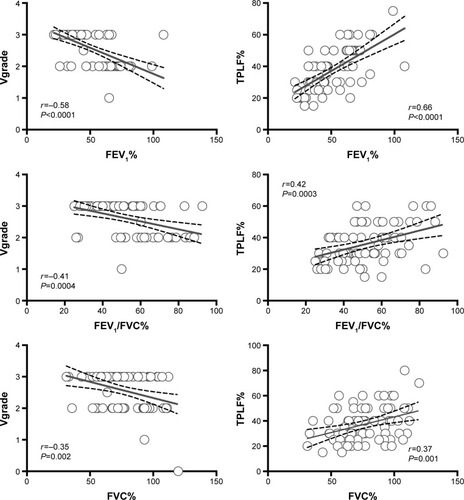
Figure 4 Vgrade 1, 2, and 3 in relation to the technically accepted and reproducible lung function test results (n=75).
Abbreviations: FEV1, forced expiratory volume in 1 second; FVC, forced vital capacity; SPECT, single-photon emission computed tomography; Vgrade, penetration grade of Technegas in V SPECT.
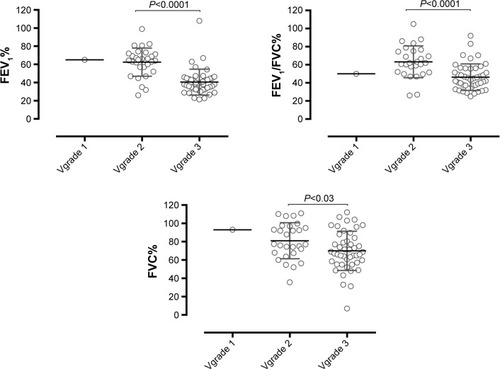
Figure 5 V/P SPECT of a patient with a severe COPD (GOLD 3).
Abbreviations: GOLD, Global Initiative for Chronic Obstructive Lung Disease; V/P SPECT, ventilation/perfusion single-photon emission computed tomography.