
Figures & data
Table 1 Characteristics of the 57 participants
Figure 1 (A) 6MWD during the 6MWT in healthy subjects and COPD patients. (B) Delta SpO2 during the 6MWT in healthy subjects and COPD patients. (C) DPA in healthy subjects and COPD patients. (D) Delta SpO2 during DPA in healthy subjects and COPD patients. **P<0.01 between groups.
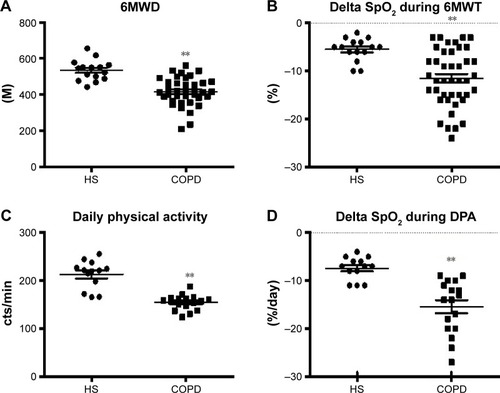
Figure 2 Time spent in each of the activities or body positions in healthy subjects and COPD patients during the entire day.
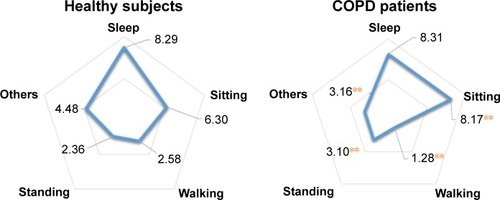
Figure 3 (A) Serum protein carbonyl levels in healthy subjects and subjects with COPD. (B) IL-6 levels in healthy subjects and COPD patients. (C) Serum TNF-α levels in healthy subjects and COPD patients. (D) Serum proteasome activity in healthy subjects and COPD patients. (E) Serum ubiquitin levels in healthy subjects and COPD patients. **P<0.01 between groups.
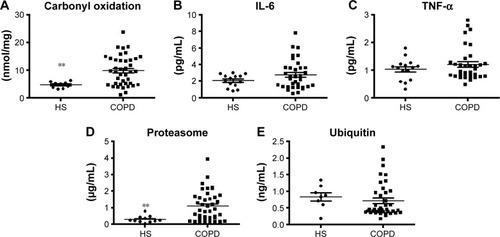
Table 2 Pearson’s correlation coefficients (r) of proteasome activity, protein carbonyl, and functional physical activity in subjects