
Figures & data
Figure 1 CT and 3D CT images of placement of a 2 cm diameter sphere in a lung.
Abbreviations: 3D, three dimensional; CT, computed tomography; R, right; L, left.
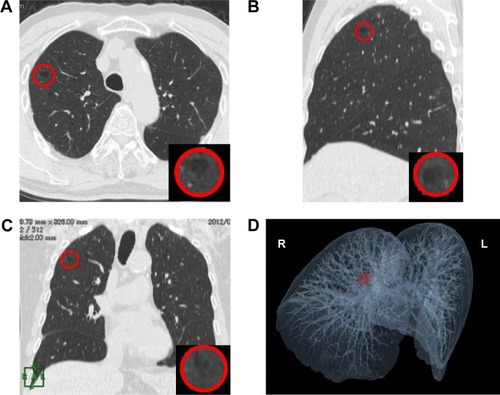
Table 1 Baseline characteristics of the study population
Figure 2 Flow chart of the study profile over 3 years of follow-up.
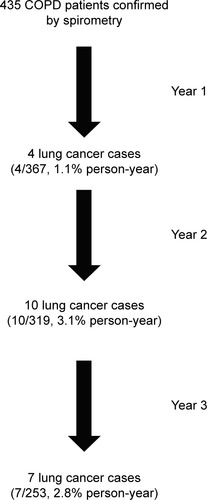
Table 2 Comparison of baseline characteristics between patients according to lung cancer development
Table 3 Emphysema as a predictor of lung cancer in COPD patients
Figure 3 (A) Frequency of emphysema at enrollment between the COPD patients who developed lung cancer and those who did not. (B) LAA% at enrollment between COPD patients who developed lung cancer afterward and those who did not. Median, 25th and 75th percentile values are displayed. P-values from chi-square tests (A) or Mann–Whitney U tests (B).
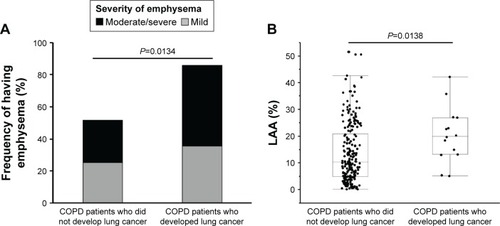
Table 4 Association of interstitial lung abnormality as a predictor of lung cancer in COPD patients
Figure 4 Frequency of interstitial abnormalities at enrollment between COPD patients who developed lung cancer and those who did not.
Abbreviation: COPD, chronic obstructive pulmonary disease.
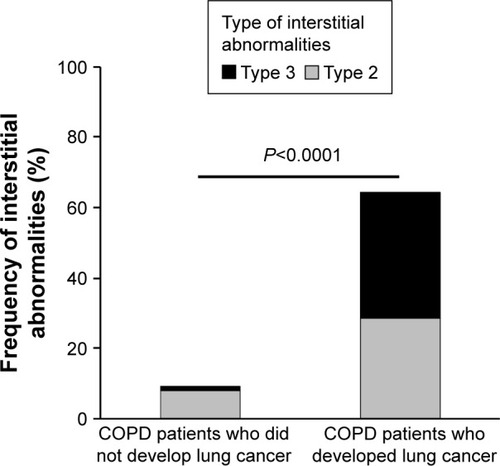
Table 5 Comparison of lung densities between the whole lung and the precancerous sphere
Figure 5 Chest CT scans before and after the appearance of a malignant lesion and the histogram of lung density distribution in a patient who had emphysema, but no interstitial abnormalities.
Notes: (A) A transverse CT image at enrollment with superimposed LAA (<−95 HU: green). The red circle indicates the precancerous sphere. (B) The location of the sphere is visualized on 3D CT image (red circle). (C) Histogram of CT density distribution of the entire lungs. The area under the curve of the histogram is total lung volume. The median of whole lung density is indicated as a dotted line. The solid line indicates the local lung density of precancerous sphere. (D) A transverse CT image when a suspicious lesion (arrow) was detected at the same level of A.
Abbreviations: CT, computed tomography; LAA, low attenuation area; HU, Hounsfield unit; 3D, three dimensional; A, anterior; R, right; L, left; P, posterior.
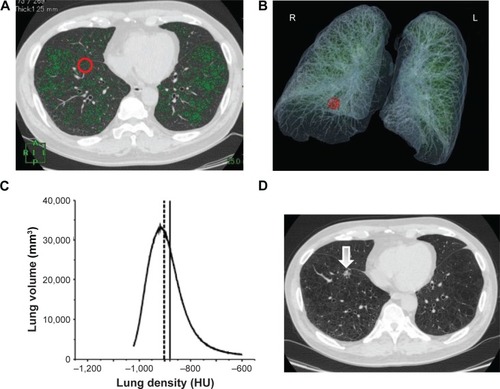
Figure 6 Chest CT scans before and after the appearance of a malignant lesion and the histogram of lung density distribution in a patient who had emphysema and interstitial abnormalities.
Abbreviations: CT, computed tomography; LAA, low attenuation area; HU, Hounsfield unit; 3D, three dimensional; R, right; L, left.
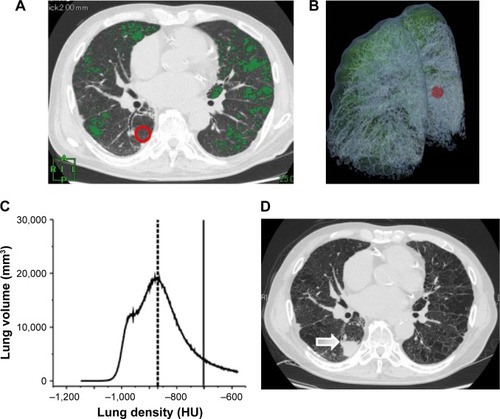
Figure S1 The histograms of the lung density of all 14 individuals.
Notes: There are five individuals without interstitial lung abnormalities (ID 1–5) and nine individuals with interstitial lung abnormalities (ID 6–14). The area under the curve of the histogram is total lung volume. The median of lung attenuation is indicated as a dotted line. The solid line indicates the local lung density of the precancerous sphere.
Abbreviation: HU, Hounsfield unit.
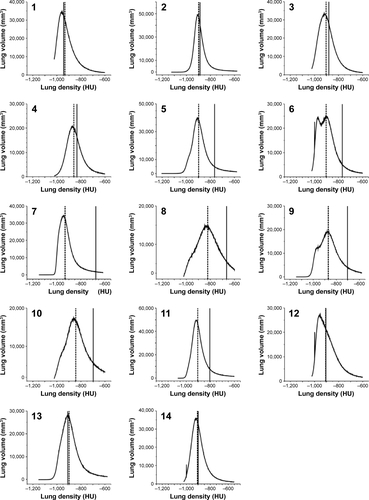
Table S1 Comparison of baseline characteristics between patients with 3-year follow-up and those who dropped out
Table S2 Comparison of baseline characteristics according to pathology of lung cancer
Table S3 Emphysema and interstitial lung abnormalities as an independent risk factor for future lung cancer in COPD patients