
Figures & data
Figure 1 Flow chart of included–excluded studies.
Abbreviations: ACLI/FOR, aclidinium/formoterol; IND/GLY, indacaterol/glycopyrronium; TIO/OLO, tiotropium/olodaterol; UMEC/VIL, umeclidinium/vilanterol.
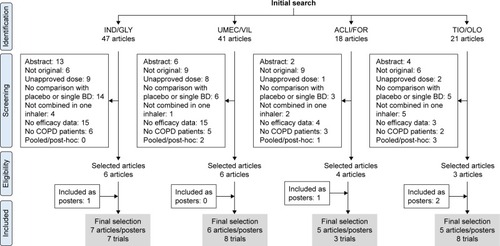
Table 1 Efficacy outcomes for double combinations versus placebo by the end of trialTable Footnotea
Table 2 Efficacy outcomes for double combinations versus their LAMA by the end of trialTable Footnotea
Table 3 Efficacy outcomes for double combinations versus tiotropium by the end of trialTable Footnotea
Table 4 Efficacy outcomes for double combinations versus their own LABA by the end of trialTable Footnotea