Figures & data
Table 1 Definitions of first and sustained CID
Table 2 Patient demographics and baseline characteristics in SHINE and LANTERN/ILLUMINATE studies
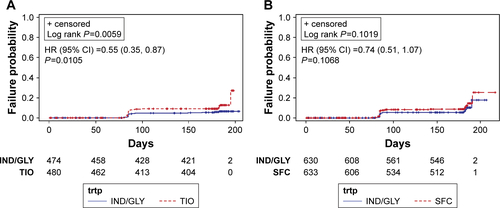
Figure 1 Kaplan–Meier curves and HR (95% CI) of time to first CID (A) and sustained CID (B) by D1 (SHINE studyCitation8).
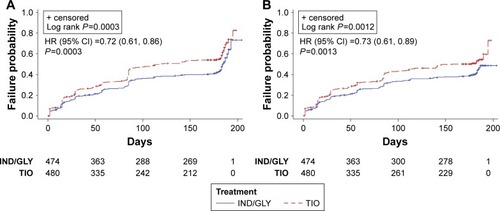
Figure 2 Kaplan–Meier curves and HR (95% CI) of time to first CID (A) and sustained CID (B) by D1 (LANTERN/ILLUMINATECitation11,Citation12).
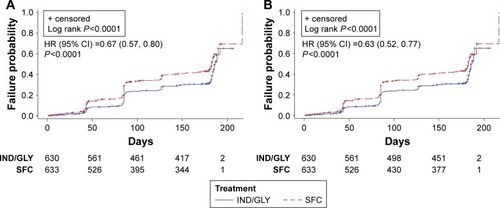
Figure 3 Kaplan–Meier curves and HR (95% CI) of time to first CID (A) and sustained CID (B) by D2 (SHINE studyCitation8).
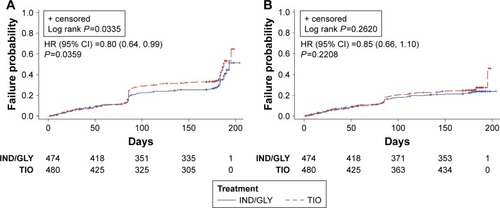
Figure 4 Kaplan–Meier curves and HR (95% CI) of time to first CID (A) and sustained CID (B) by D2 (LANTERN/ILLUMINATECitation11,Citation12).
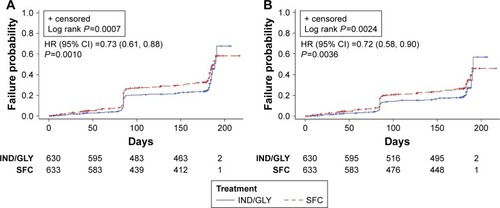
Figure 5 HRs and 95% CI (IND/GLY versus TIO) for first and sustained CID by subgroups in SHINECitation8 using D1 (A and B) and D2 (C and D).
Abbreviations: HR, hazard ratio; CI, confidence interval; CID, clinically important deterioration; D1, Definition 1; D2, Definition 2; IND/GLY, indacaterol/glycopyrronium; TIO, tiotropium.
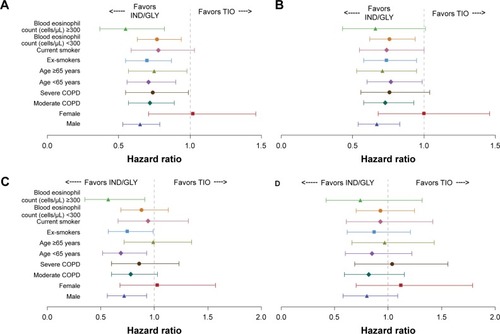
Figure 6 HRs and 95% CI (IND/GLY versus SFC) for first and sustained CID by subgroups in LANTERN/ILLUMINATECitation11,Citation12 using D1 (A and B) and D2 (C and D).
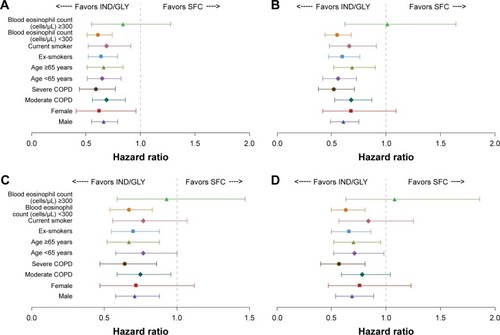
Figure S1 Kaplan–Meier curves (with numbers of subjects at risk and 95% CIs) of time to first CID: IND/GLY versus TIO: SHINECitation1: (A) time to first exacerbation, (B) time to first FEV1 ≤ −100, (C) time to first SGRQ ≥4, (D) time to first TDI ≤ −1.
Abbreviations: CI, confidence interval; HR, hazard ratio; CID, clinically important deterioration; IND/GLY, indacaterol/glycopyrronium; TDI, Transition Dyspnea Index; TIO, tiotropium; FEV1, forced expiratory volume in 1 second; SGRQ, St George’s Respiratory Questionnaire; trtp, treatment.
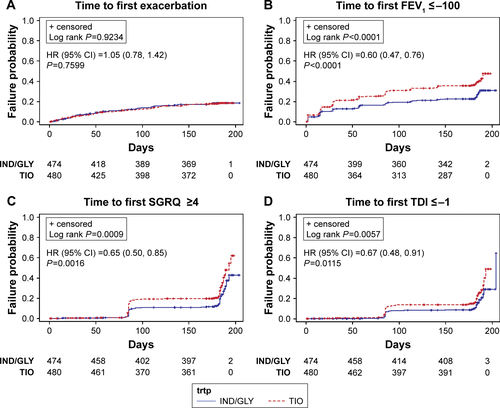
Figure S2 Kaplan–Meier curves (with numbers of subjects at risk and 95% CIs) of time to first CID: IND/GLY versus SFC: LANTERN/ILLUMINATECitation2,Citation3: (A) time to first exacerbation, (B) time to first FEV1 ≤ −100, (C) time to first SGRQ ≥4, (D) time to first TDI ≤ −1.
Abbreviations: CI, confidence interval; HR, hazard ratio; CID, clinically important deterioration; IND/GLY, indacaterol/glycopyrronium; SFC, salmeterol/fluticasone; SGRQ, St George’s Respiratory Questionnaire; TDI, Transition Dyspnea Index; trtp, treatment.
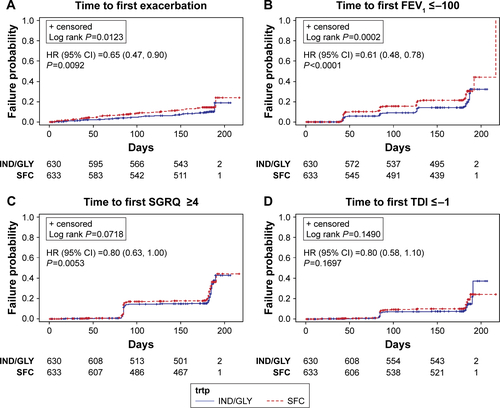
Figure S3 Kaplan–Meier curves (with numbers of subjects at risk and 95% CIs) on the component of sustained CID for (A) IND/GLY versus TIO (SHINECitation1) and (B) IND/GLY versus SFC (LANTERN/ILLUMINATECitation2,Citation3).
Abbreviations: CI, confidence interval; HR, hazard ratio; CID, clinically important deterioration; IND/GLY, indacaterol/glycopyrronium; TIO, tiotropium; SFC, salmeterol/fluticasone; trtp, treatment.