
Figures & data
Table 1 Descriptive statistics of the study population (n=50)
Figure 1 Coronary 3D surface view of a processed HRCT scan of the lung acquired in inspiration depicting the lung lobes (semitransparent green, lower lobes; semitransparent red, upper lobe; semitransparent blue, right middle lobe) and voxels with a density below −950 HU (orange).
Abbreviation: HRCT, high-resolution computed tomography.
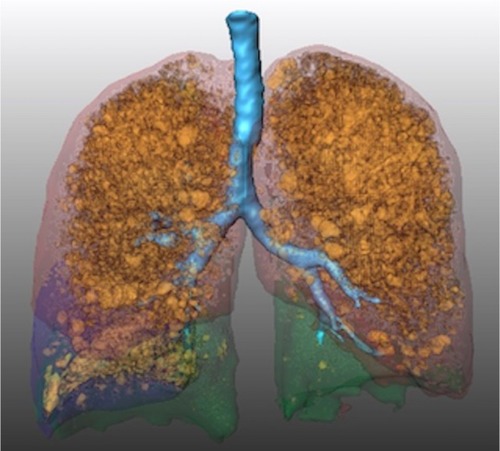
Table 2 Definitions of the six interlobar emphysema heterogeneity indices investigated in our study
Table 3 Overview of the major characteristics of the interlobar emphysema heterogeneity indices investigated in this study
Table 4 ROC curve analysis to determine the predictive accuracy of the different HIs with respect to FEV1 improvement after ELVR
Table 5 Critical values of the HI 6 and HI 4 with their respective sensitivity and specificity that can be considered to identify relevant emphysema heterogeneity with regard to the prediction of significant improvement in FEV1 after ELVR
Figure 2 ROC of all HIs.
Abbreviations: HI, heterogeneity index; ROC, receiver-operating characteristic.
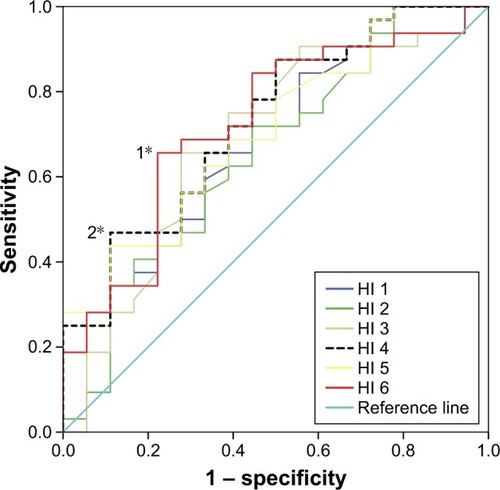
Table 6 ROC curve analysis of all patients with a tendency toward upper lobe predominant emphysema and upper lobe treatment (n=24) to determine the predictive accuracy of the different HIs with respect to FEV1 improvement after ELVR, assuming an increase in FEV1 of 100 mL to indicate MCID
Table 7 ROC curve analysis of all patients with a tendency toward lower lobe predominant emphysema and lower lobe treatment (n=38) to determine the predictive accuracy of the different HIs with respect to FEV1 improvement after ELVR, assuming an increase in FEV1 of 100 mL to indicate MCID
Figure 3 Receiver-operating characteristic of all patients with a tendency toward upper lobe predominant emphysema and upper lobe treatment (n=24).
Abbreviation: HI, heterogeneity index.
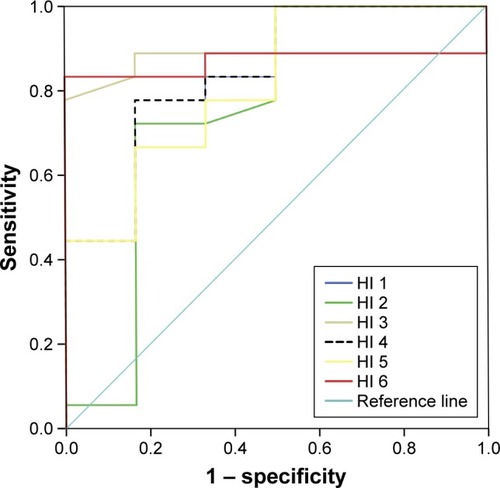
Figure 4 Receiver-operating characteristic of all patients with a tendency toward lower lobe predominant emphysema and lower lobe treatment (n=38).
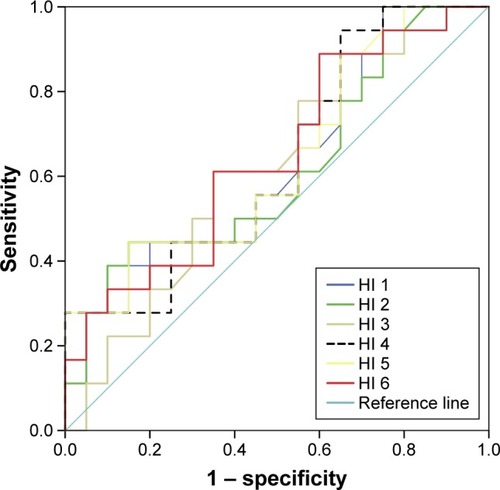
Table S1 ROC curve analysis of all patients (n=62) to determine the predictive accuracy of the different volume-weighted HIs (HI * targeted lobe volume) with respect to FEV1 increased after ELVR assuming an increase in FEV1 of 100 mL to indicate MCID
Table S2 Definitions of the additional HIs calculated from the TAR
Table S3 ROC curve analysis of all patients (n=62) to determine the predictive accuracy of HIs calculated from the TAR with respect to FEV1 change after ELVR assuming an increase of FEV1 of 100 mL to indicate MCID
Table S4 ROC curve analysis of all patients (n=62) to determine the predictive accuracy of the different HIs with respect to FEV1 improvement after ELVR assuming an increase in FEV1 of 100 mL to indicate MCID
Table S5 ROC curve analysis of all patients with available 6MWT results (n=44) to determine the predictive accuracy of the different HIs with respect to 6MWT improvement after ELVR, assuming an increase in 6MWT of 26 minutes to indicate MCID
Table S6 ROC curve analysis of all patients with available SGRQ test results (n=47) to determine the predictive accuracy of the different HIs with respect to SGRQ improvement after ELVR, assuming an increase in SGRQ of 4 units to indicate MCID
Table S7 ROC curve analysis of all patients (n=62) to determine the predictive accuracy of the different HIs with respect to RV reduction after ELVR, assuming a decrease in RV of 0.31 L to indicate MCID