
Figures & data
Table 1 Demographic characteristics, pulmonary function test results, hemodynamics, and echocardiography parameters of patients with normal/PH vs severe PH
Figure 1 Flow diagram for the main derivation cohort. Of the 369 patients with CLD and suspected PH who were referred to the Cardio-Pulmonary Circulation Center of Shanghai Pulmonary Hospital within the study period, 107 met the inclusion criteria and were considered in the analysis.
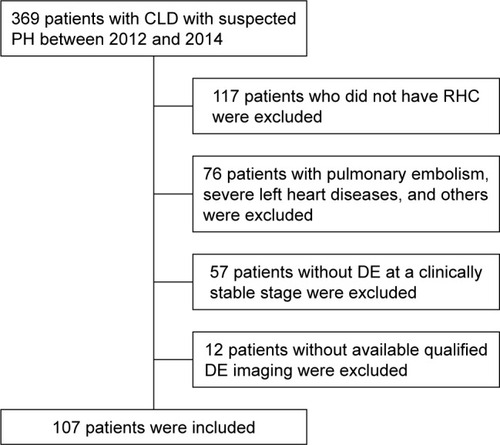
Table 2 Logistic regression analysis of echocardiography parameters associated with severe PH
Table 3 The distribution of echocardiography parameters and accuracy for discrimination
Figure 2 The receiver-operator characteristic curve is shown for PASP alone as determined by echocardiography variables and for ESI in predicting severe PH.
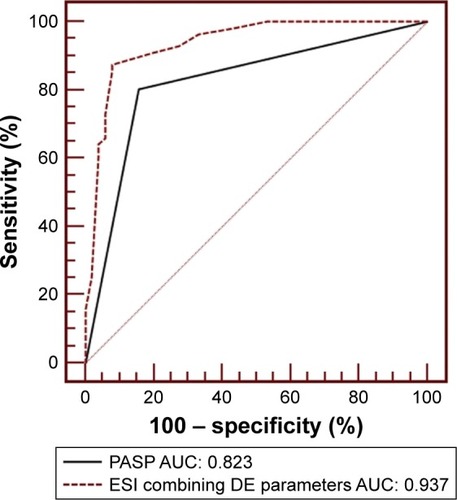
Figure 3 Representative echocardiographic images of RVEDTD, PASP, PAd, and tricuspid annular plane systolic excursion as well as the score calculation for two patients. Column A (top to bottom) shows ↑RVEDTD and ↑PASP (score =−1). Invasive hemodynamics: mPAP =30 mmHg, PAWP =11 mmHg, PVR =6.0 Wood units, and cardiac index =3.1 L/min/m2. Column B shows ↑RVEDTD, ↑PASP, ↑PAd, and ↓TAPSE (score =4). Invasive hemodynamics: mPAP =39 mmHg, PAWP =11 mmHg, PVR =6.0 Wood units, and cardiac index =3.35 L/min/m2.
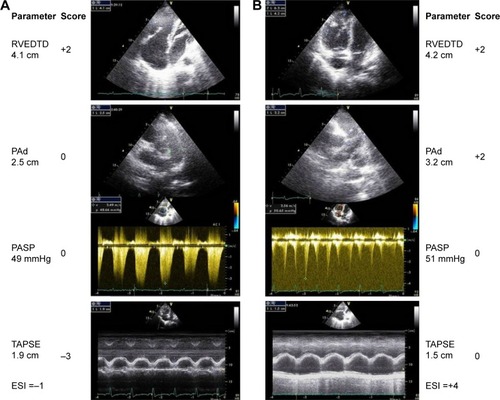
Table S1 Sensitivity, specificity, positive predictive values, and negative predictive values of the diagnostic index
Table S2 Comparison of characteristics of patients of derivation cohort vs validation cohort
Table S3 Comparison of hemodynamics and echocardiography parameters of patients of derivation cohort vs validation cohort