Figures & data
Table 1 Characteristics of patients directly answering the questionnaire (patients) and those reported by GPs or PULs
Table 2 Heat map expression of the magnitude of differences between patients’ perceptions reported by GPs and PULs vs those directly reported by the patients
Figure 1 COPD impact on QoL and its domains as perceived by the patients and by GPs and PULs answering about patients’ perception.
Notes: Mean values of the scores assigned to QoL and its domains stratified by disease severity. *Student’s t-test for the comparison between scores directly assigned by patients and those reported by PULs is statistically significant. t-tests for the comparisons between scores directly assigned by patients and those reported by GPs for the severe/very severe class were not performed due to the low number of GPs describing a patient with severe or very severe COPD.
Abbreviations: GPs, general practitioners; PULs, pulmonologists; QoL, quality of life.
Abbreviations: GPs, general practitioners; PULs, pulmonologists; QoL, quality of life.
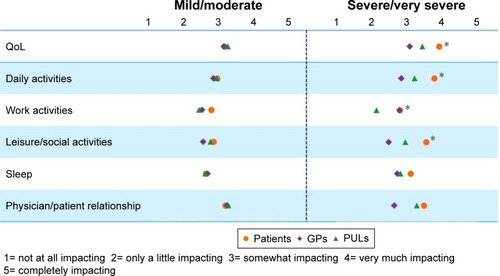
Figure 2 COPD impact on daily activities subdomains as perceived by the patients and by GPs and PULs answering about patients’ perception.
Notes: Mean values of the scores assigned stratified by disease severity. *Student’s t-test for the comparison between scores directly assigned by patients and those reported by PULs is statistically significant. t-tests for the comparisons between scores directly assigned by patients and those reported by GPs for the severe/very severe class were not performed due to the low number of GPs describing a patient with severe or very severe COPD.
Abbreviations: GPs, general practitioners; PULs, pulmonologists.
Abbreviations: GPs, general practitioners; PULs, pulmonologists.
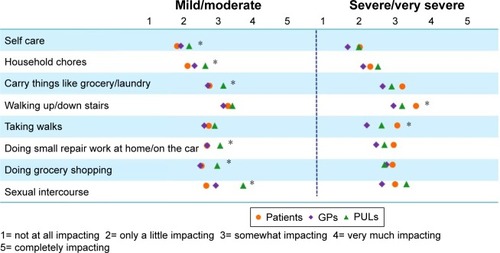
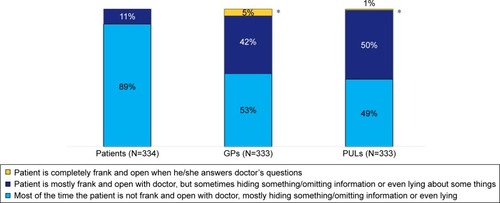
Figure 3 Patients’ attitude during the visit with the health care professional of reference as perceived by patients, GPs, and PULs.
Note: *The comparison with patients directly answering the questionnaire is statistically significant based on the results from chi-square test.
Abbreviations: GPs, general practitioners; PULs, pulmonologists.
Abbreviations: GPs, general practitioners; PULs, pulmonologists.