Figures & data
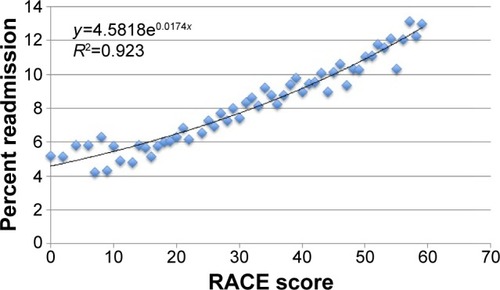
Figure 1 Flowchart of data exclusions used to create the Readmission After COPD Exacerbation risk Scale.
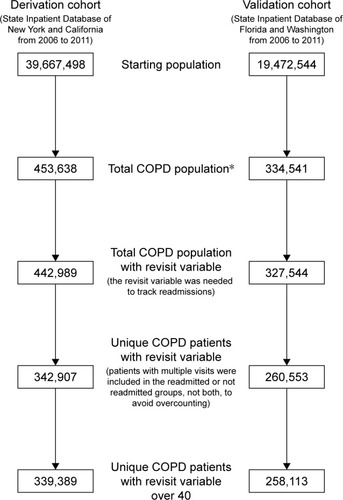
Table 1 Demographic and comorbidities data involving 339,389 COPD patients of derivation cohort
Table 2 Demographic and comorbidities data involving 258,113 COPD patients of validation cohort
Figure 2 Readmission rates by demographic and clinicopathological characteristic among COPD patients of derivation cohort.
Abbreviations: LOS, length of stay (days); CHF, congestive heart failure; PCD, pulmonary circulation disorder; FED, fluid and electrolyte disorder; PVD, peripheral vascular disease; PUD, peptic ulcer disease.
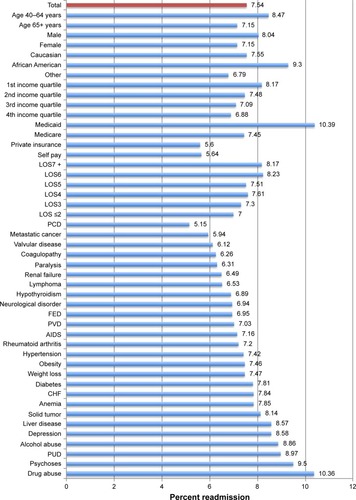
Figure 3 Readmission rates by demographic and clinicopathological characteristic among COPD patients of validation cohort.
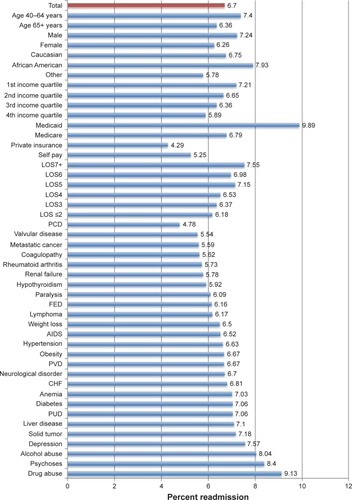
Table 3 Univariate and multivariate analysis of factors predicting readmission after COPD of derivation cohort
Table 4 Univariate and multivariate analysis of factors predicting readmission after COPD of validation cohort
Table 5 Values for components of Readmission After COPD Exacerbation (RACE) Scale
Figure 4 Readmission After COPD Exacerbation (RACE) scores vs percent readmission among all patients.